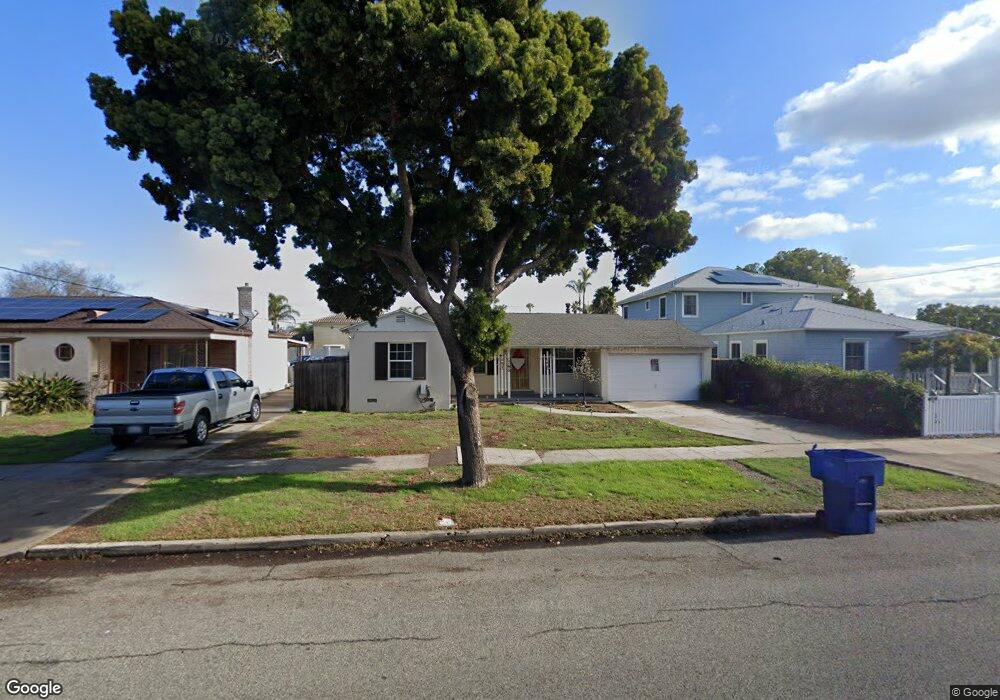
745 2nd Ave Chula Vista, CA 91910
Hilltop NeighborhoodEstimated Value: $712,000 - $750,000
3
Beds
1
Bath
1,058
Sq Ft
$695/Sq Ft
Est. Value
About This Home
This home is located at 745 2nd Ave, Chula Vista, CA 91910 and is currently estimated at $735,524, approximately $695 per square foot. 745 2nd Ave is a home located in San Diego County with nearby schools including Hilltop Drive Elementary School, Hilltop Middle School, and Hilltop Senior High School.
Ownership History
Date
Name
Owned For
Owner Type
Purchase Details
Closed on
Jan 14, 2021
Sold by
Drewett Gerald E and Drewett Desiree L
Bought by
Drewett Gerald E and Drewett Desiree L
Current Estimated Value
Purchase Details
Closed on
May 29, 2012
Sold by
Cloe Lorena and Marquez Lorena
Bought by
Rossoff Gregory M and Rossoff Maria S
Home Financials for this Owner
Home Financials are based on the most recent Mortgage that was taken out on this home.
Original Mortgage
$240,052
Outstanding Balance
$166,443
Interest Rate
3.84%
Mortgage Type
VA
Estimated Equity
$569,081
Purchase Details
Closed on
Apr 1, 2009
Sold by
Marquez Yolanda
Bought by
Marquez Lorena and Cloe Lorena
Purchase Details
Closed on
Jun 14, 2006
Sold by
Marquez Lorena
Bought by
Marquez Yolanda and Marquez Lorena
Purchase Details
Closed on
Mar 14, 2006
Sold by
White Mark Alan
Bought by
Marquez Lorena
Home Financials for this Owner
Home Financials are based on the most recent Mortgage that was taken out on this home.
Original Mortgage
$387,200
Interest Rate
6.35%
Mortgage Type
Fannie Mae Freddie Mac
Purchase Details
Closed on
May 1, 2003
Sold by
Ward Julia
Bought by
White Mark Alan
Create a Home Valuation Report for This Property
The Home Valuation Report is an in-depth analysis detailing your home's value as well as a comparison with similar homes in the area
Home Values in the Area
Average Home Value in this Area
Purchase History
| Date | Buyer | Sale Price | Title Company |
|---|---|---|---|
| Drewett Gerald E | -- | Amrock Inc | |
| Rossoff Gregory M | $235,000 | California Title Company | |
| Marquez Lorena | -- | None Available | |
| Marquez Yolanda | -- | None Available | |
| Marquez Lorena | $484,000 | California Title Company | |
| White Mark Alan | -- | -- |
Source: Public Records
Mortgage History
| Date | Status | Borrower | Loan Amount |
|---|---|---|---|
| Open | Rossoff Gregory M | $240,052 | |
| Previous Owner | Marquez Lorena | $387,200 |
Source: Public Records
Tax History
| Year | Tax Paid | Tax Assessment Tax Assessment Total Assessment is a certain percentage of the fair market value that is determined by local assessors to be the total taxable value of land and additions on the property. | Land | Improvement |
|---|---|---|---|---|
| 2025 | $3,335 | $295,157 | $187,828 | $107,329 |
| 2024 | $3,335 | $289,371 | $184,146 | $105,225 |
| 2023 | $3,287 | $283,698 | $180,536 | $103,162 |
| 2022 | $3,192 | $278,137 | $176,997 | $101,140 |
| 2021 | $3,117 | $272,684 | $173,527 | $99,157 |
| 2020 | $3,042 | $269,889 | $171,748 | $98,141 |
| 2019 | $2,962 | $264,598 | $168,381 | $96,217 |
| 2018 | $2,915 | $259,411 | $165,080 | $94,331 |
| 2017 | $2,852 | $254,326 | $161,844 | $92,482 |
| 2016 | $2,784 | $249,340 | $158,671 | $90,669 |
| 2015 | $2,744 | $245,596 | $156,288 | $89,308 |
| 2014 | $2,697 | $240,786 | $153,227 | $87,559 |
Source: Public Records
Map
Nearby Homes
- 765 Church Ave
- 112 Country Club Dr
- 633 Del Mar Ave
- 268 Sierra Way
- 617 3rd Ave Unit 14
- 709 Brightwood Ave
- 732 Brightwood Ave
- 285 Moss St Unit 9
- 520 Glover Ave
- 927 Agua Tibia Ave
- 279 Moss St Unit 3
- 279 Moss St Unit 10
- 440 L St Unit J
- 1040 2nd Ave
- 431 Del Mar Ct
- 345 Moss St Unit 7
- 515 Avenida Centro Unit 101
- 471 4th Ave
- 475 4th Ave Unit H
- 471 4th Ave Unit B
Your Personal Tour Guide
Ask me questions while you tour the home.