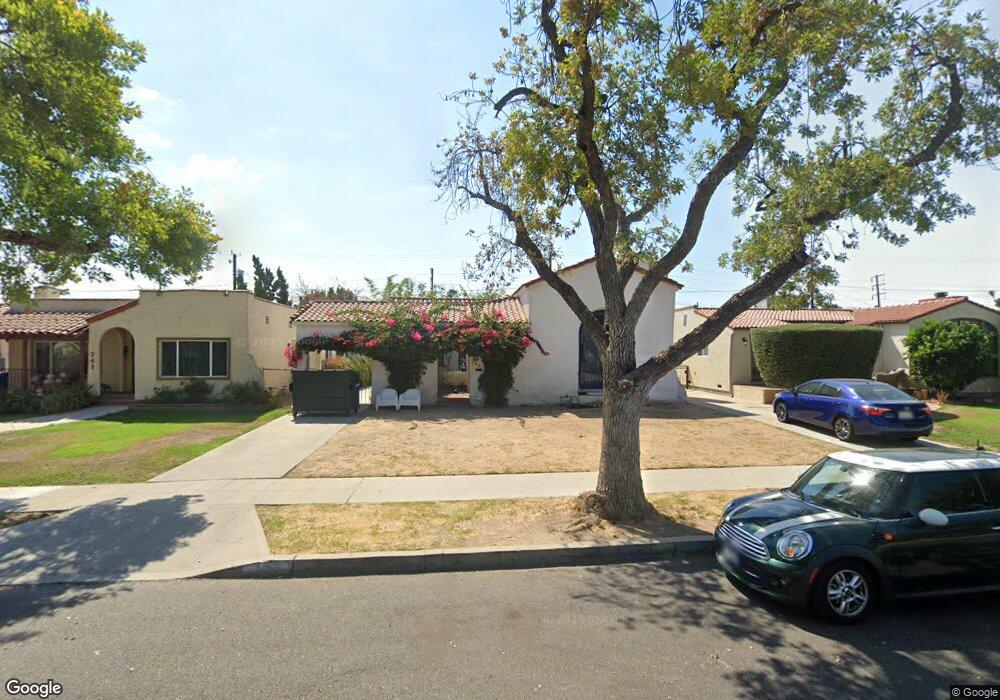
745 N Brighton St Burbank, CA 91506
Chandler Park NeighborhoodEstimated Value: $1,332,000 - $1,538,000
3
Beds
1
Bath
1,680
Sq Ft
$845/Sq Ft
Est. Value
About This Home
This home is located at 745 N Brighton St, Burbank, CA 91506 and is currently estimated at $1,418,914, approximately $844 per square foot. 745 N Brighton St is a home located in Los Angeles County with nearby schools including Thomas Edison Elementary School, Dolores Huerta Middle School, and John Burroughs High School.
Ownership History
Date
Name
Owned For
Owner Type
Purchase Details
Closed on
Feb 24, 2020
Sold by
Anderson David R
Bought by
Martinez Dominique
Current Estimated Value
Home Financials for this Owner
Home Financials are based on the most recent Mortgage that was taken out on this home.
Original Mortgage
$500,000
Outstanding Balance
$442,715
Interest Rate
3.6%
Mortgage Type
New Conventional
Estimated Equity
$976,199
Purchase Details
Closed on
Feb 21, 2020
Sold by
Martinez Jose E
Bought by
Martinez Esperanza
Home Financials for this Owner
Home Financials are based on the most recent Mortgage that was taken out on this home.
Original Mortgage
$500,000
Outstanding Balance
$442,715
Interest Rate
3.6%
Mortgage Type
New Conventional
Estimated Equity
$976,199
Purchase Details
Closed on
Jul 26, 2006
Sold by
Burris John M and Burris Sharon L
Bought by
Martinez Dominique
Home Financials for this Owner
Home Financials are based on the most recent Mortgage that was taken out on this home.
Original Mortgage
$559,200
Interest Rate
7.43%
Mortgage Type
Negative Amortization
Create a Home Valuation Report for This Property
The Home Valuation Report is an in-depth analysis detailing your home's value as well as a comparison with similar homes in the area
Home Values in the Area
Average Home Value in this Area
Purchase History
| Date | Buyer | Sale Price | Title Company |
|---|---|---|---|
| Martinez Dominique | -- | Corinthian Title Company Inc | |
| Martinez Esperanza | -- | Corinthian Title | |
| Martinez Dominique | -- | Corinthian Title | |
| Martinez Hope | -- | Corinthian Title | |
| Martinez Dominique | $699,000 | Equity Title |
Source: Public Records
Mortgage History
| Date | Status | Borrower | Loan Amount |
|---|---|---|---|
| Open | Martinez Dominique | $500,000 | |
| Closed | Martinez Dominique | $559,200 |
Source: Public Records
Tax History Compared to Growth
Tax History
| Year | Tax Paid | Tax Assessment Tax Assessment Total Assessment is a certain percentage of the fair market value that is determined by local assessors to be the total taxable value of land and additions on the property. | Land | Improvement |
|---|---|---|---|---|
| 2025 | $10,346 | $941,240 | $757,372 | $183,868 |
| 2024 | $10,346 | $922,785 | $742,522 | $180,263 |
| 2023 | $10,235 | $904,692 | $727,963 | $176,729 |
| 2022 | $9,771 | $886,954 | $713,690 | $173,264 |
| 2021 | $9,732 | $869,564 | $699,697 | $169,867 |
| 2019 | $9,291 | $839,521 | $671,621 | $167,900 |
| 2018 | $9,142 | $823,060 | $658,452 | $164,608 |
| 2016 | $7,307 | $665,000 | $530,900 | $134,100 |
| 2015 | $7,266 | $665,000 | $530,900 | $134,100 |
| 2014 | $6,838 | $615,000 | $491,000 | $124,000 |
Source: Public Records
Map
Nearby Homes
- 835 N Lincoln St
- 831 N Myers St
- 726 N Keystone St
- 914 N Catalina St
- 1121 N Frederic St
- 930 N Keystone St
- 2914 W Chandler Blvd
- 825 N Catalina St
- 611 N Buena Vista St
- 1115 N Florence St
- 934 N Fairview St
- 500 N Lamer St
- 1219 N Lincoln St
- 819 N Fairview St
- 1232 N Lincoln St
- 405 N Brighton St
- 830 N Reese Place
- 532 N Reese Place
- 625 N Niagara St
- 330 N Myers St
- 741 N Brighton St
- 749 N Brighton St
- 737 N Brighton St
- 801 N Brighton St
- 844 N Buena Vista St
- 850 N Buena Vista St
- 840 N Buena Vista St
- 733 N Brighton St
- 805 N Brighton St
- 900 N Buena Vista St
- 836 N Buena Vista St
- 744 N Brighton St
- 727 N Brighton St
- 809 N Brighton St
- 832 N Buena Vista St
- 904 N Buena Vista St
- 740 N Brighton St
- 748 N Brighton St
- 736 N Brighton St
- 800 N Brighton St