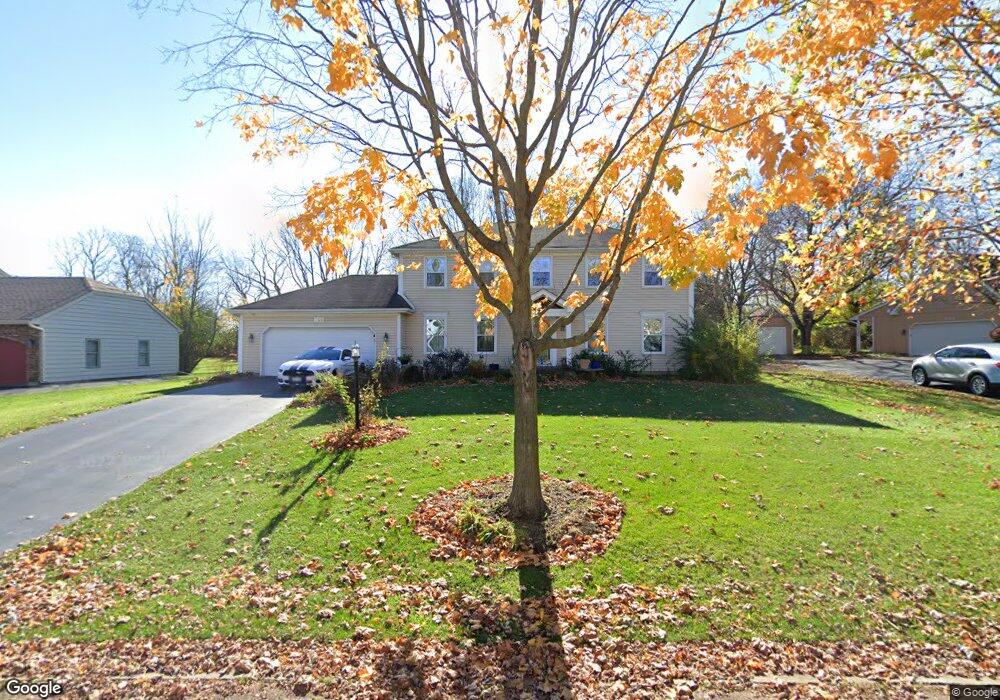
745 Sprucetree Ln Algonquin, IL 60102
Estimated Value: $410,713 - $487,000
4
Beds
3
Baths
2,408
Sq Ft
$189/Sq Ft
Est. Value
About This Home
This home is located at 745 Sprucetree Ln, Algonquin, IL 60102 and is currently estimated at $455,928, approximately $189 per square foot. 745 Sprucetree Ln is a home located in Kane County with nearby schools including Westfield Community School, Kenneth E Neubert Elementary School, and Harry D Jacobs High School.
Ownership History
Date
Name
Owned For
Owner Type
Purchase Details
Closed on
Aug 10, 2022
Sold by
Michael Obrien Sean
Bought by
Obrien Living Trust
Current Estimated Value
Purchase Details
Closed on
Sep 16, 2003
Sold by
Overom Peter C
Bought by
Obrien Sean Michael and Obrien Lisa Marie
Home Financials for this Owner
Home Financials are based on the most recent Mortgage that was taken out on this home.
Original Mortgage
$207,250
Interest Rate
6.03%
Mortgage Type
Purchase Money Mortgage
Purchase Details
Closed on
Mar 8, 2001
Sold by
Overom Patti A
Bought by
Overom Peter C
Purchase Details
Closed on
Sep 8, 1994
Sold by
Oneill John S and Oneill Mary Ann
Bought by
Overom Peter C and Overom Patti A
Home Financials for this Owner
Home Financials are based on the most recent Mortgage that was taken out on this home.
Original Mortgage
$165,000
Interest Rate
8.44%
Create a Home Valuation Report for This Property
The Home Valuation Report is an in-depth analysis detailing your home's value as well as a comparison with similar homes in the area
Purchase History
| Date | Buyer | Sale Price | Title Company |
|---|---|---|---|
| Obrien Living Trust | -- | Larsen Edlund And Ernest Pc | |
| Obrien Sean Michael | $275,000 | Ntl Title Llc | |
| Overom Peter C | -- | -- | |
| Overom Peter C | $225,000 | Ticor Title Ins |
Source: Public Records
Mortgage History
| Date | Status | Borrower | Loan Amount |
|---|---|---|---|
| Previous Owner | Obrien Sean Michael | $207,250 | |
| Previous Owner | Overom Peter C | $165,000 |
Source: Public Records
Tax History
| Year | Tax Paid | Tax Assessment Tax Assessment Total Assessment is a certain percentage of the fair market value that is determined by local assessors to be the total taxable value of land and additions on the property. | Land | Improvement |
|---|---|---|---|---|
| 2024 | $8,598 | $121,090 | $27,168 | $93,922 |
| 2023 | $8,216 | $108,953 | $24,445 | $84,508 |
| 2022 | $7,839 | $99,798 | $24,445 | $75,353 |
| 2021 | $7,608 | $94,229 | $23,081 | $71,148 |
| 2020 | $7,460 | $92,110 | $22,562 | $69,548 |
| 2019 | $7,741 | $93,181 | $21,418 | $71,763 |
| 2018 | $7,510 | $87,452 | $26,182 | $61,270 |
| 2017 | $7,207 | $81,807 | $24,492 | $57,315 |
| 2016 | $7,392 | $79,209 | $23,714 | $55,495 |
| 2015 | -- | $74,222 | $22,221 | $52,001 |
| 2014 | -- | $69,889 | $21,607 | $48,282 |
| 2013 | -- | $72,028 | $22,268 | $49,760 |
Source: Public Records
Map
Nearby Homes
- 308 Rustic Ln
- Lot #3-5 Hayes Rd
- 1200 Hillside View
- SWC Talaga and Algonquin Rd
- 1460 Lancaster Ln
- 1530 Westbourne Pkwy
- 1540 Westbourne Pkwy
- 0 Natoma Trail
- 615 Harper Dr
- 1002 Interloch Ct Unit 152
- lot 25 Wabican Trail
- 21 Division St
- 1850 White Oak Dr
- 1621 Glengarry Ct Unit 131
- 18N741 Westhill Rd
- 2224 Barrett Dr
- 407 La Fox River Dr
- 1900 Waverly Ln
- 18 Peach Tree Ct Unit 4154
- 301 Cold Spring St
- 735 Sprucetree Ln
- 755 Sprucetree Ln
- 725 Sprucetree Ln
- 730 Sprucetree Ln
- 740 Sprucetree Ln
- 765 Sprucetree Ln
- 720 Sprucetree Ln
- 715 Sprucetree Ln
- 750 Sprucetree Ln
- 775 Sprucetree Ln
- 760 Sprucetree Ln
- 745 Gaslight Dr
- 755 Gaslight Dr
- 705 Sprucetree Ln
- 735 Gaslight Dr
- 765 Gaslight Dr
- 700 Sprucetree Ln
- 725 Gaslight Dr
- 1465 Braewood Dr
- 1505 Braewood Dr
Your Personal Tour Guide
Ask me questions while you tour the home.