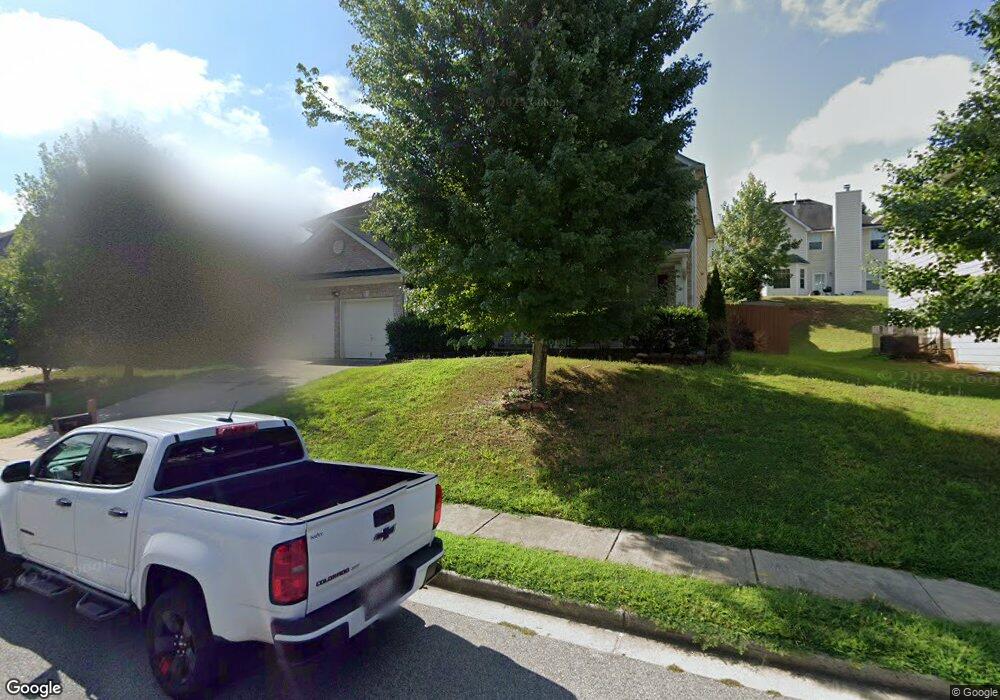
7450 Spoleto Loop Unit 49 Fairburn, GA 30213
Estimated Value: $323,000 - $345,558
4
Beds
3
Baths
2,800
Sq Ft
$119/Sq Ft
Est. Value
About This Home
This home is located at 7450 Spoleto Loop Unit 49, Fairburn, GA 30213 and is currently estimated at $332,140, approximately $118 per square foot. 7450 Spoleto Loop Unit 49 is a home located in Fulton County with nearby schools including E. C. West Elementary School, Bear Creek Middle School, and Creekside High School.
Ownership History
Date
Name
Owned For
Owner Type
Purchase Details
Closed on
May 29, 2020
Sold by
Wilson William
Bought by
Wilson William and Jackson Takisha T
Current Estimated Value
Home Financials for this Owner
Home Financials are based on the most recent Mortgage that was taken out on this home.
Original Mortgage
$220,924
Outstanding Balance
$195,832
Interest Rate
3.2%
Mortgage Type
FHA
Estimated Equity
$136,308
Purchase Details
Closed on
Sep 2, 2016
Sold by
Nancy Y
Bought by
Morrow William
Home Financials for this Owner
Home Financials are based on the most recent Mortgage that was taken out on this home.
Original Mortgage
$170,848
Interest Rate
3.62%
Mortgage Type
FHA
Purchase Details
Closed on
Jul 20, 2009
Sold by
Legacy Cmntys Of Cedar Grove L
Bought by
Charles Nancy Y
Home Financials for this Owner
Home Financials are based on the most recent Mortgage that was taken out on this home.
Original Mortgage
$159,886
Interest Rate
5.53%
Mortgage Type
FHA
Create a Home Valuation Report for This Property
The Home Valuation Report is an in-depth analysis detailing your home's value as well as a comparison with similar homes in the area
Home Values in the Area
Average Home Value in this Area
Purchase History
| Date | Buyer | Sale Price | Title Company |
|---|---|---|---|
| Wilson William | -- | -- | |
| Wilson William | $225,000 | -- | |
| Morrow William | $174,000 | -- | |
| Charles Nancy Y | $162,900 | -- |
Source: Public Records
Mortgage History
| Date | Status | Borrower | Loan Amount |
|---|---|---|---|
| Open | Wilson William | $220,924 | |
| Closed | Wilson William | $220,924 | |
| Previous Owner | Morrow William | $170,848 | |
| Previous Owner | Charles Nancy Y | $159,886 |
Source: Public Records
Tax History
| Year | Tax Paid | Tax Assessment Tax Assessment Total Assessment is a certain percentage of the fair market value that is determined by local assessors to be the total taxable value of land and additions on the property. | Land | Improvement |
|---|---|---|---|---|
| 2025 | $5,471 | $132,800 | $27,840 | $104,960 |
| 2023 | $5,471 | $165,960 | $38,040 | $127,920 |
| 2022 | $4,086 | $104,200 | $22,680 | $81,520 |
| 2021 | $3,593 | $89,760 | $19,080 | $70,680 |
| 2020 | $2,829 | $69,520 | $15,040 | $54,480 |
| 2019 | $2,569 | $65,040 | $9,760 | $55,280 |
| 2018 | $1,930 | $67,960 | $9,520 | $58,440 |
| 2017 | $1,976 | $48,480 | $10,600 | $37,880 |
| 2016 | $1,094 | $43,960 | $10,600 | $33,360 |
| 2015 | $1,098 | $43,960 | $10,600 | $33,360 |
| 2014 | $1,131 | $43,960 | $10,600 | $33,360 |
Source: Public Records
Map
Nearby Homes
- 7576 Jennadee Dr
- 7512 Rivertown Rd
- 7506 Rivertown Rd
- 7504 Rivertown Rd
- 6343 Pheasant Trail
- 7580 Rivertown Rd
- 7580 Rivertown Rd Unit LOT 14
- 0 Rivertown Rd Unit 10627089
- 0 Rivertown Rd Unit 10728825
- 0 Rivertown Rd Unit 7748114
- 6711 Bishop Rd
- 7613 Cedar Grove Ct
- 7768 Richmond Trail
- 8050 Dickens Dr
- 6725 Homer Ln Unit 74
- 6725 Homer Ln
- 8046 Dickens Dr Unit 46
- 8043 Dickens Dr
- 8051 Dickens Dr Unit 58
- 6713 Homer Ln
- 7450 Spoleto Loop
- 7446 Spoleto Loop
- 7454 Spoleto Loop
- 7526 Spoleto Loop
- 7522 Spoleto Loop
- 7442 Spoleto Loop
- 7449 Spoleto Loop
- 7453 Spoleto Loop
- 7518 Spoleto Loop
- 7538 Spoleto Loop
- 7445 Spoleto Loop
- 7457 Spoleto Loop
- 7462 Spoleto Loop
- 7550 Spoleto Loop
- 7514 Spoleto Loop
- 7441 Spoleto Loop
- 7461 Spoleto Loop
- 7525 Spoleto Loop
- 7525 Spoleto Loop Unit 26
- 7521 Spoleto Loop
Your Personal Tour Guide
Ask me questions while you tour the home.