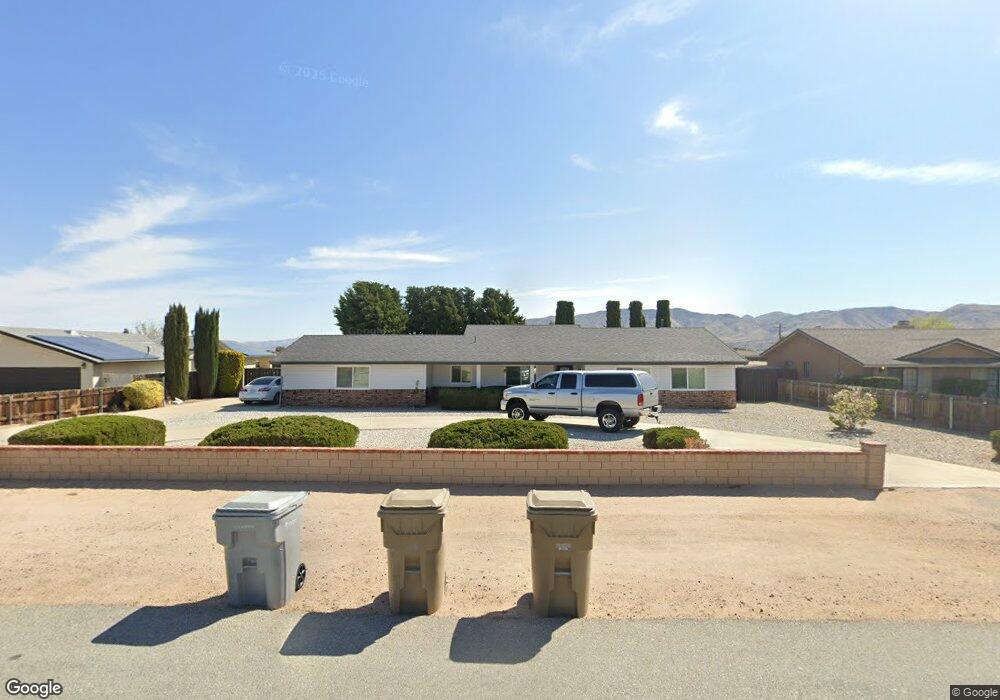
7451 Madera Ave Hesperia, CA 92345
The Mesa NeighborhoodEstimated Value: $404,786 - $457,000
3
Beds
2
Baths
1,494
Sq Ft
$288/Sq Ft
Est. Value
About This Home
This home is located at 7451 Madera Ave, Hesperia, CA 92345 and is currently estimated at $429,697, approximately $287 per square foot. 7451 Madera Ave is a home located in San Bernardino County with nearby schools including Kingston Elementary School, Ranchero Middle School, and Sultana High School.
Ownership History
Date
Name
Owned For
Owner Type
Purchase Details
Closed on
Apr 28, 2025
Sold by
Castro Moises and Castro Christina
Bought by
Moises Larios Castro and Moises Christina Dawn
Current Estimated Value
Purchase Details
Closed on
Oct 9, 2015
Sold by
Steinwand Brian D and Steinwand Nancy
Bought by
Castro Moises and Castro Christina
Home Financials for this Owner
Home Financials are based on the most recent Mortgage that was taken out on this home.
Original Mortgage
$172,975
Interest Rate
3.75%
Mortgage Type
FHA
Purchase Details
Closed on
Aug 16, 2004
Sold by
Steinwand Brian D
Bought by
Steinwand Brian D and Steinwand Nancy
Purchase Details
Closed on
Jul 11, 1994
Sold by
Va
Bought by
Keck Edward D and Keck Dianne M
Home Financials for this Owner
Home Financials are based on the most recent Mortgage that was taken out on this home.
Original Mortgage
$95,400
Interest Rate
8.51%
Create a Home Valuation Report for This Property
The Home Valuation Report is an in-depth analysis detailing your home's value as well as a comparison with similar homes in the area
Home Values in the Area
Average Home Value in this Area
Purchase History
| Date | Buyer | Sale Price | Title Company |
|---|---|---|---|
| Moises Larios Castro | -- | None Listed On Document | |
| Castro Moises | $190,000 | Chicago Title Company | |
| Steinwand Brian D | -- | Commonwealth Land Title | |
| Keck Edward D | -- | Chicago Title Company |
Source: Public Records
Mortgage History
| Date | Status | Borrower | Loan Amount |
|---|---|---|---|
| Previous Owner | Castro Moises | $172,975 | |
| Previous Owner | Keck Edward D | $95,400 |
Source: Public Records
Tax History
| Year | Tax Paid | Tax Assessment Tax Assessment Total Assessment is a certain percentage of the fair market value that is determined by local assessors to be the total taxable value of land and additions on the property. | Land | Improvement |
|---|---|---|---|---|
| 2025 | $2,460 | $224,923 | $44,985 | $179,938 |
| 2024 | $2,404 | $220,513 | $44,103 | $176,410 |
| 2023 | $2,376 | $216,189 | $43,238 | $172,951 |
| 2022 | $2,320 | $211,950 | $42,390 | $169,560 |
| 2021 | $2,277 | $207,794 | $41,559 | $166,235 |
| 2020 | $2,250 | $205,663 | $41,133 | $164,530 |
| 2019 | $2,202 | $201,630 | $40,326 | $161,304 |
| 2018 | $2,159 | $197,676 | $39,535 | $158,141 |
| 2017 | $2,119 | $193,800 | $38,760 | $155,040 |
| 2016 | $2,073 | $190,000 | $38,000 | $152,000 |
| 2015 | -- | $109,474 | $18,610 | $90,864 |
| 2014 | $1,245 | $107,329 | $18,245 | $89,084 |
Source: Public Records
Map
Nearby Homes
- 7469 Madera Ave
- 7576 Peach Ave
- 18126 Fairburn St
- 7841 Corona Ave
- 39833319 Plumas St
- 18540 Fairburn St
- 39833428 Fairburn St
- 1 Langdon Ave
- 17995 Seaforth St
- 7331 I Ave
- 0 Whisper Ln Unit IV25244814
- 7191 Doheny Ct
- 7181 Doheny Ct
- 7171 Doheny Ct
- 7946 Gaylop Ave
- 18525 Seaforth St
- 7181 Dohney Ct
- 7158 Dohney Ct
- 7161 Dohney Ct
- 7171 Dohney Ct
- 7437 Madera Ave
- 7468 Corona Ave
- 7452 Corona Ave
- 18312 Ranchero Rd
- 7486 Corona Ave
- 7483 Madera Ave
- 7448 Madera Ave
- 7466 Madera Ave
- 7434 Madera Ave
- 7502 Corona Ave
- 7480 Madera Ave
- 7497 Madera Ave
- 7518 Corona Ave
- 7494 Madera Ave
- 7431 El Cerrito Ave
- 7477 Corona Ave
- 7415 El Cerrito Ave
- 7455 Corona Ave
- 7447 El Cerrito Ave
- 18315 Ranchero Rd
Your Personal Tour Guide
Ask me questions while you tour the home.