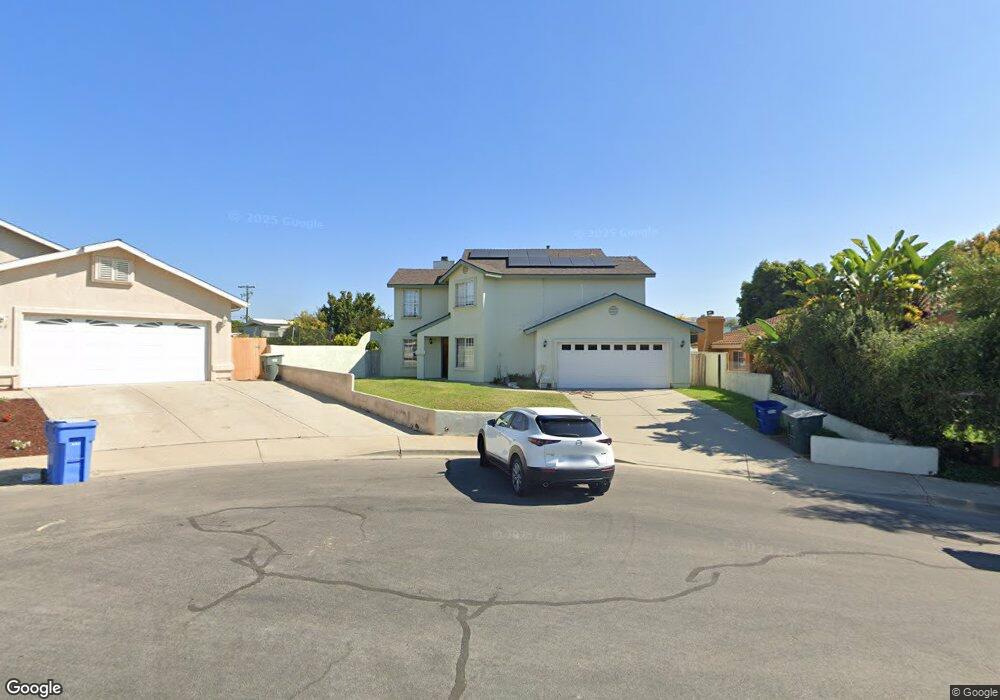
746 Rosana Place Nipomo, CA 93444
Estimated Value: $755,000 - $926,000
3
Beds
3
Baths
2,100
Sq Ft
$397/Sq Ft
Est. Value
About This Home
This home is located at 746 Rosana Place, Nipomo, CA 93444 and is currently estimated at $833,354, approximately $396 per square foot. 746 Rosana Place is a home located in San Luis Obispo County with nearby schools including Dorothea Lange Elementary School, Mesa Middle School, and Nipomo High School.
Ownership History
Date
Name
Owned For
Owner Type
Purchase Details
Closed on
Mar 31, 2025
Sold by
Garcia Cynthia
Bought by
Christian Vested Hearts and Christian Garcia
Current Estimated Value
Purchase Details
Closed on
Mar 31, 2017
Sold by
Garcia Cynthia
Bought by
Garcia Cynthia
Purchase Details
Closed on
Oct 7, 1996
Sold by
Federal Deposit Insurance Corporation
Bought by
Garcia Cynthia M
Home Financials for this Owner
Home Financials are based on the most recent Mortgage that was taken out on this home.
Original Mortgage
$147,240
Interest Rate
8.3%
Purchase Details
Closed on
Jan 24, 1996
Sold by
Fursman Ken James and Fursman Kelli Jo
Bought by
Rtc
Create a Home Valuation Report for This Property
The Home Valuation Report is an in-depth analysis detailing your home's value as well as a comparison with similar homes in the area
Home Values in the Area
Average Home Value in this Area
Purchase History
| Date | Buyer | Sale Price | Title Company |
|---|---|---|---|
| Christian Vested Hearts | -- | None Listed On Document | |
| Garcia Cynthia | -- | None Listed On Document | |
| Garcia Cynthia | -- | None Available | |
| Garcia Cynthia M | -- | -- | |
| Rtc | $153,000 | Cuesta Title |
Source: Public Records
Mortgage History
| Date | Status | Borrower | Loan Amount |
|---|---|---|---|
| Previous Owner | Garcia Cynthia M | $147,240 |
Source: Public Records
Tax History Compared to Growth
Tax History
| Year | Tax Paid | Tax Assessment Tax Assessment Total Assessment is a certain percentage of the fair market value that is determined by local assessors to be the total taxable value of land and additions on the property. | Land | Improvement |
|---|---|---|---|---|
| 2025 | $2,462 | $239,381 | $97,702 | $141,679 |
| 2024 | $2,434 | $234,688 | $95,787 | $138,901 |
| 2023 | $2,434 | $230,087 | $93,909 | $136,178 |
| 2022 | $2,397 | $225,576 | $92,068 | $133,508 |
| 2021 | $2,393 | $221,154 | $90,263 | $130,891 |
| 2020 | $2,366 | $218,887 | $89,338 | $129,549 |
| 2019 | $2,351 | $214,596 | $87,587 | $127,009 |
| 2018 | $2,323 | $210,389 | $85,870 | $124,519 |
| 2017 | $2,280 | $206,265 | $84,187 | $122,078 |
| 2016 | $2,150 | $202,222 | $82,537 | $119,685 |
| 2015 | $2,119 | $199,186 | $81,298 | $117,888 |
| 2014 | $2,041 | $195,285 | $79,706 | $115,579 |
Source: Public Records
Map
Nearby Homes
- 522 Higos Way
- 483 Violet Ave
- 725 Monarch Ln
- 840 Story St
- 626 Juno Ct
- 232 Scarlett Cir
- 945 Jeanette Ln
- 450 Avenida de Socios Unit 12
- 368 Avenida de Amigos
- 525 Grande Ave Unit D
- 426 Polaris Dr
- Mesa Plan at Hill Street Terraces - Hill Street Series
- Pacific Plan at Hill Street Terraces - Hill Street Series
- Monarch Plan at Hill Street Terraces - Hill Street Series
- Rancho Plan at Hill Street Terraces - Hill Street Series
- Dana Plan at Hill Street Terraces - Hill Street Series
- 680 Hill St
- 1127 Starlite Dr
- 393 Uranus Ct
- 261 Hazel Ln