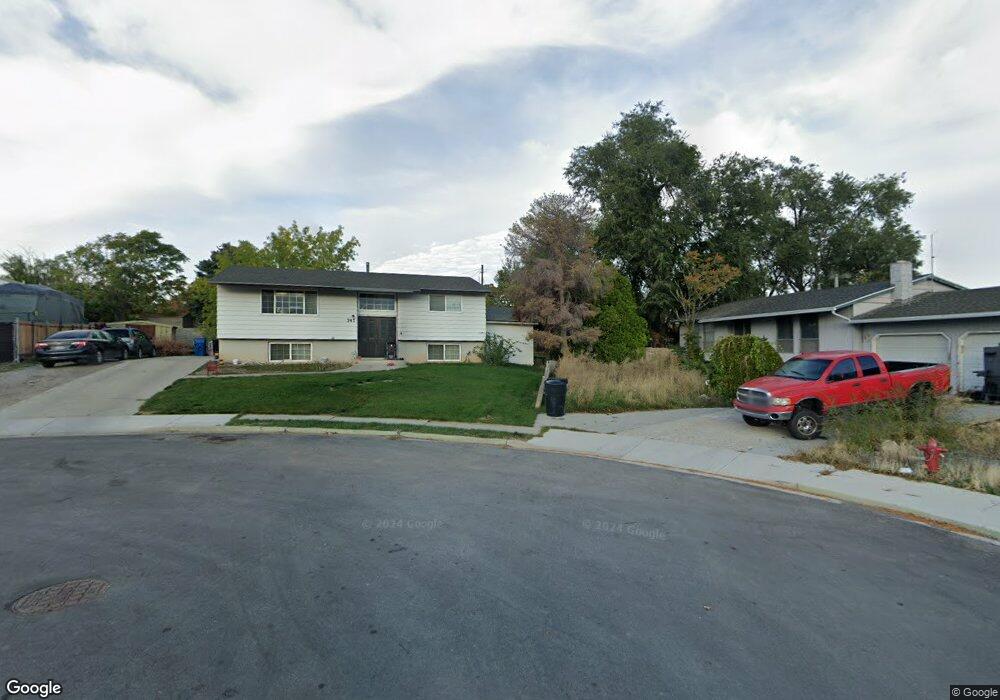
747 E 350 N Payson, UT 84651
Estimated Value: $401,333 - $419,000
4
Beds
2
Baths
2,034
Sq Ft
$203/Sq Ft
Est. Value
About This Home
This home is located at 747 E 350 N, Payson, UT 84651 and is currently estimated at $412,778, approximately $202 per square foot. 747 E 350 N is a home located in Utah County with nearby schools including Barnett Elementary School, Salem Junior High School, and Valley View Middle School.
Ownership History
Date
Name
Owned For
Owner Type
Purchase Details
Closed on
Dec 4, 2002
Sold by
Hansen Felipa
Bought by
Hansen Troy A and Hansen Felipa R
Current Estimated Value
Home Financials for this Owner
Home Financials are based on the most recent Mortgage that was taken out on this home.
Original Mortgage
$98,800
Outstanding Balance
$42,561
Interest Rate
6.28%
Estimated Equity
$370,217
Purchase Details
Closed on
Apr 28, 1999
Sold by
Aames Capital Corp
Bought by
Hansen Troy A and Delapena Felipa R
Home Financials for this Owner
Home Financials are based on the most recent Mortgage that was taken out on this home.
Original Mortgage
$101,850
Interest Rate
6.98%
Create a Home Valuation Report for This Property
The Home Valuation Report is an in-depth analysis detailing your home's value as well as a comparison with similar homes in the area
Home Values in the Area
Average Home Value in this Area
Purchase History
| Date | Buyer | Sale Price | Title Company |
|---|---|---|---|
| Hansen Troy A | -- | Backman Stewart Title Servi | |
| Hansen Felipa | -- | Backman Stewart Title Servi | |
| Hansen Troy A | -- | Metro National Title |
Source: Public Records
Mortgage History
| Date | Status | Borrower | Loan Amount |
|---|---|---|---|
| Open | Hansen Felipa | $98,800 | |
| Closed | Hansen Troy A | $101,850 |
Source: Public Records
Tax History
| Year | Tax Paid | Tax Assessment Tax Assessment Total Assessment is a certain percentage of the fair market value that is determined by local assessors to be the total taxable value of land and additions on the property. | Land | Improvement |
|---|---|---|---|---|
| 2025 | $1,791 | $192,445 | -- | -- |
| 2024 | $1,791 | $182,270 | $0 | $0 |
| 2023 | $1,824 | $186,175 | $0 | $0 |
| 2022 | $1,910 | $191,675 | $0 | $0 |
| 2021 | $1,631 | $262,600 | $93,300 | $169,300 |
| 2020 | $1,545 | $243,300 | $84,800 | $158,500 |
| 2019 | $1,323 | $213,700 | $75,900 | $137,800 |
| 2018 | $1,247 | $194,000 | $67,800 | $126,200 |
| 2017 | $1,099 | $91,960 | $0 | $0 |
| 2016 | $1,052 | $87,505 | $0 | $0 |
| 2015 | $942 | $77,770 | $0 | $0 |
| 2014 | $868 | $72,160 | $0 | $0 |
Source: Public Records
Map
Nearby Homes
Your Personal Tour Guide
Ask me questions while you tour the home.