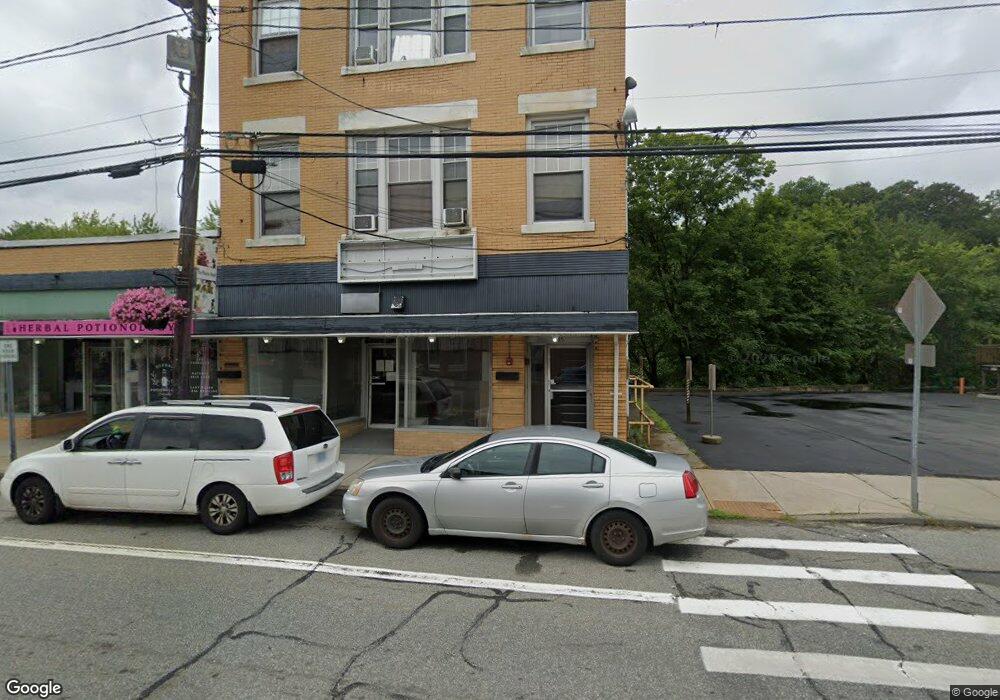
747 Main St West Warwick, RI 02893
Lippitt-Harris NeighborhoodEstimated Value: $406,846
5
Beds
5
Baths
10,800
Sq Ft
$38/Sq Ft
Est. Value
About This Home
This home is located at 747 Main St, West Warwick, RI 02893 and is currently estimated at $406,846, approximately $37 per square foot. 747 Main St is a home located in Kent County with nearby schools including West Warwick High School and St Joseph School.
Ownership History
Date
Name
Owned For
Owner Type
Purchase Details
Closed on
Dec 31, 2012
Sold by
Bouyssou Serge and Bouyssou Elizabeth A
Bought by
5Mf Holding Llc
Current Estimated Value
Home Financials for this Owner
Home Financials are based on the most recent Mortgage that was taken out on this home.
Original Mortgage
$160,000
Outstanding Balance
$30,711
Interest Rate
3.5%
Mortgage Type
Commercial
Estimated Equity
$376,135
Purchase Details
Closed on
Apr 19, 2004
Sold by
Bertrand Raymond D
Bought by
Bouyssou Serge D and Bouyssou Elizabeth A
Create a Home Valuation Report for This Property
The Home Valuation Report is an in-depth analysis detailing your home's value as well as a comparison with similar homes in the area
Home Values in the Area
Average Home Value in this Area
Purchase History
| Date | Buyer | Sale Price | Title Company |
|---|---|---|---|
| 5Mf Holding Llc | $160,000 | -- | |
| Bouyssou Serge D | $350,000 | -- |
Source: Public Records
Mortgage History
| Date | Status | Borrower | Loan Amount |
|---|---|---|---|
| Open | Bouyssou Serge D | $160,000 |
Source: Public Records
Tax History
| Year | Tax Paid | Tax Assessment Tax Assessment Total Assessment is a certain percentage of the fair market value that is determined by local assessors to be the total taxable value of land and additions on the property. | Land | Improvement |
|---|---|---|---|---|
| 2025 | $7,475 | $523,100 | $85,100 | $438,000 |
| 2024 | $9,983 | $304,200 | $56,500 | $247,700 |
| 2023 | $9,543 | $304,200 | $56,500 | $247,700 |
| 2022 | $0 | $304,200 | $56,500 | $247,700 |
| 2021 | $9,983 | $287,700 | $44,300 | $243,400 |
| 2020 | $9,983 | $287,700 | $44,300 | $243,400 |
| 2019 | $8,435 | $287,700 | $44,300 | $243,400 |
| 2018 | $0 | $228,200 | $42,900 | $185,300 |
| 2017 | $0 | $167,200 | $42,900 | $124,300 |
| 2016 | -- | $167,200 | $42,900 | $124,300 |
| 2015 | -- | $175,300 | $40,800 | $134,500 |
| 2014 | -- | $175,300 | $40,800 | $134,500 |
Source: Public Records
Map
Nearby Homes
Your Personal Tour Guide
Ask me questions while you tour the home.