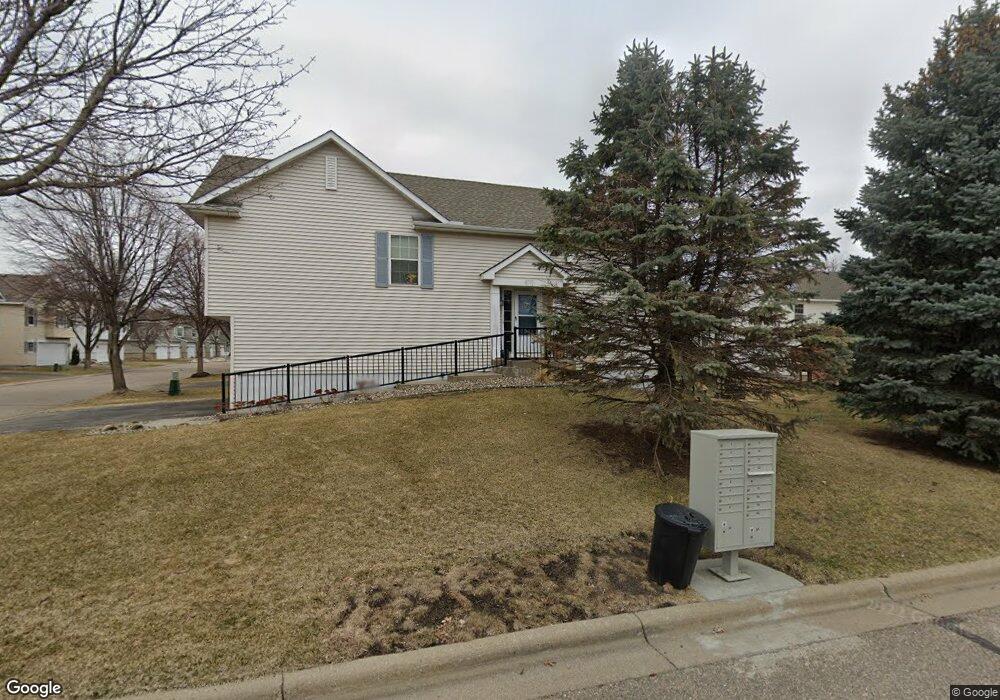
7487 Devin Ln Shakopee, MN 55379
Estimated Value: $327,995 - $341,000
4
Beds
3
Baths
1,878
Sq Ft
$179/Sq Ft
Est. Value
About This Home
This home is located at 7487 Devin Ln, Shakopee, MN 55379 and is currently estimated at $335,249, approximately $178 per square foot. 7487 Devin Ln is a home located in Scott County with nearby schools including Red Oak Elementary School, Shakopee West Middle School, and Shakopee Senior High School.
Ownership History
Date
Name
Owned For
Owner Type
Purchase Details
Closed on
Aug 6, 2010
Sold by
Federal Home Loan Mortgage Corporation
Bought by
Singh Gurdeep and Kaur Harpreet
Current Estimated Value
Home Financials for this Owner
Home Financials are based on the most recent Mortgage that was taken out on this home.
Original Mortgage
$7,101
Outstanding Balance
$4,704
Interest Rate
4.58%
Mortgage Type
New Conventional
Estimated Equity
$330,545
Purchase Details
Closed on
Oct 29, 2002
Sold by
Mccolman Donald and Mccolman Marie Anne
Bought by
Thi Bo Tran and Thi Luom Nguyen
Purchase Details
Closed on
Aug 13, 2001
Sold by
Joplin Jeffrey and Joplin Rachelle M
Bought by
Mccolman Marie Anne and Mccolman Donald
Purchase Details
Closed on
Feb 28, 2001
Sold by
The Ryland Group Inc
Bought by
Joplin Jeffrey N and Joplin Rachelle M
Purchase Details
Closed on
May 10, 1999
Sold by
Shakopee Crossings Ltd Partnership
Bought by
The Ryland Group Inc
Create a Home Valuation Report for This Property
The Home Valuation Report is an in-depth analysis detailing your home's value as well as a comparison with similar homes in the area
Home Values in the Area
Average Home Value in this Area
Purchase History
| Date | Buyer | Sale Price | Title Company |
|---|---|---|---|
| Singh Gurdeep | $147,500 | -- | |
| Thi Bo Tran | $208,900 | -- | |
| Mccolman Marie Anne | $195,000 | -- | |
| Joplin Jeffrey N | $182,760 | -- | |
| The Ryland Group Inc | $1,400,000 | -- |
Source: Public Records
Mortgage History
| Date | Status | Borrower | Loan Amount |
|---|---|---|---|
| Open | Singh Gurdeep | $7,101 |
Source: Public Records
Tax History
| Year | Tax Paid | Tax Assessment Tax Assessment Total Assessment is a certain percentage of the fair market value that is determined by local assessors to be the total taxable value of land and additions on the property. | Land | Improvement |
|---|---|---|---|---|
| 2025 | $3,430 | $340,800 | $114,100 | $226,700 |
| 2024 | $2,978 | $325,200 | $108,700 | $216,500 |
| 2023 | $3,042 | $277,700 | $63,900 | $213,800 |
| 2022 | $3,170 | $279,300 | $65,500 | $213,800 |
| 2021 | $2,826 | $249,300 | $51,300 | $198,000 |
| 2020 | $3,138 | $242,800 | $47,300 | $195,500 |
| 2019 | $3,030 | $236,700 | $50,000 | $186,700 |
| 2018 | $2,884 | $0 | $0 | $0 |
| 2016 | $2,726 | $0 | $0 | $0 |
| 2014 | -- | $0 | $0 | $0 |
Source: Public Records
Map
Nearby Homes
- 7506 Hampton Ln
- 1339 Yorkshire Ln
- 7463 Derby Ln Unit 907
- 7343 Derby Ln
- 1693 Windsor Dr S
- 1763 Switchgrass Ct
- 1764 Fescue Ct
- 1782 Switchgrass Cir
- 8506 Grove Cir
- 1820 Foothill Trail
- 1821 Foothill Trail
- 8530 Grove Cir
- 1955 Red Oak
- 1999 Red Oak Path
- 7427 Water St
- 7459 Waters Edge Ave
- 2087 Brookview St
- 7696 Waverly Ave
- 7554 Waverly Ave
- 7660 Waverly Ave
Your Personal Tour Guide
Ask me questions while you tour the home.