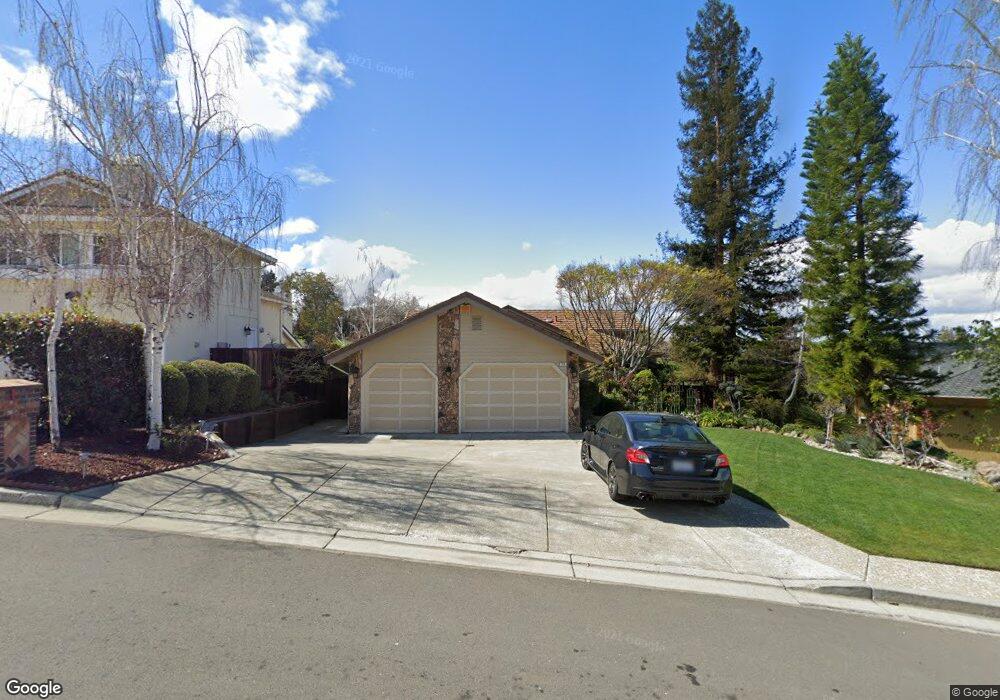
749 Excelso Ct Fremont, CA 94539
Mission San Jose NeighborhoodEstimated Value: $2,534,000 - $3,373,000
4
Beds
4
Baths
2,700
Sq Ft
$1,082/Sq Ft
Est. Value
About This Home
This home is located at 749 Excelso Ct, Fremont, CA 94539 and is currently estimated at $2,922,707, approximately $1,082 per square foot. 749 Excelso Ct is a home located in Alameda County with nearby schools including Mission San Jose Elementary School, William Hopkins Junior High School, and Mission San Jose High School.
Ownership History
Date
Name
Owned For
Owner Type
Purchase Details
Closed on
Oct 27, 2011
Sold by
Chen Celia S
Bought by
Chen Celia S and Celia S Chen Revocable Trust
Current Estimated Value
Purchase Details
Closed on
Jun 4, 2011
Sold by
Chen Chen Celia S Celia S and Chen Lin Celia Suzanne
Bought by
Chen Celia S
Purchase Details
Closed on
Aug 17, 2010
Sold by
Lin Wen
Bought by
Lin Celia Suzanne Chen
Purchase Details
Closed on
Oct 1, 2009
Sold by
Lin Celia S C and Chen Celia S
Bought by
Lin Wen and Lin Celia S C
Purchase Details
Closed on
Aug 31, 1999
Sold by
Lin Wen
Bought by
Chen Celia S
Purchase Details
Closed on
Jan 29, 1997
Sold by
Vigil Albert H and Vigil Linda S
Bought by
Lin Wen and Chen Celia S
Home Financials for this Owner
Home Financials are based on the most recent Mortgage that was taken out on this home.
Original Mortgage
$340,000
Outstanding Balance
$36,508
Interest Rate
7%
Estimated Equity
$2,886,199
Purchase Details
Closed on
Nov 4, 1996
Sold by
Vigil Linda S
Bought by
Vigil Albert H
Create a Home Valuation Report for This Property
The Home Valuation Report is an in-depth analysis detailing your home's value as well as a comparison with similar homes in the area
Home Values in the Area
Average Home Value in this Area
Purchase History
| Date | Buyer | Sale Price | Title Company |
|---|---|---|---|
| Chen Celia S | -- | None Available | |
| Chen Celia S | -- | None Available | |
| Lin Celia Suzanne Chen | -- | None Available | |
| Lin Wen | -- | None Available | |
| Chen Celia S | -- | -- | |
| Lin Wen | $500,000 | Placer Title Company | |
| Vigil Albert H | -- | Old Republic Title Company |
Source: Public Records
Mortgage History
| Date | Status | Borrower | Loan Amount |
|---|---|---|---|
| Open | Lin Wen | $340,000 |
Source: Public Records
Tax History
| Year | Tax Paid | Tax Assessment Tax Assessment Total Assessment is a certain percentage of the fair market value that is determined by local assessors to be the total taxable value of land and additions on the property. | Land | Improvement |
|---|---|---|---|---|
| 2025 | $9,750 | $803,617 | $244,288 | $566,329 |
| 2024 | $9,750 | $787,724 | $239,499 | $555,225 |
| 2023 | $9,487 | $779,145 | $234,804 | $544,341 |
| 2022 | $9,362 | $756,869 | $230,200 | $533,669 |
| 2021 | $9,132 | $741,892 | $225,687 | $523,205 |
| 2020 | $9,153 | $741,217 | $223,374 | $517,843 |
| 2019 | $9,048 | $726,687 | $218,995 | $507,692 |
| 2018 | $8,870 | $712,442 | $214,702 | $497,740 |
| 2017 | $8,648 | $698,475 | $210,493 | $487,982 |
| 2016 | $8,500 | $684,783 | $206,367 | $478,416 |
| 2015 | $8,422 | $677,560 | $203,268 | $474,292 |
| 2014 | $8,276 | $664,290 | $199,287 | $465,003 |
Source: Public Records
Map
Nearby Homes
- 43524 Ocaso Corte
- 43548 Ocaso Corte
- 43249 Gallegos Ave
- 43684 Southerland Way
- 353 Dana St
- 341 Dana St
- 43583 Southerland Way
- 43220 Giovanni Terrace
- 43896 Paso Pino Common
- 42642 Sully St
- 43342 Bryant St
- 43147 Calle Sagrada
- 222 Corte San Pablo
- 42600 Baron St
- 2244 Jackson St
- 42329 Troyer Ave
- 1905 Lockwood Ave
- 2449 Washington Blvd
- 42077 Miranda St
- 42194 Camino Santa Barbara
- 729 Excelso Ct
- 769 Excelso Ct
- 43485 Vista Del Mar
- 43475 Vista Del Mar
- 754 Excelso Ct
- 43465 Vista Del Mar
- 43505 Vista Del Mar
- 789 Excelso Ct
- 43515 Vista Del Mar
- 774 Excelso Ct
- 809 Excelso Ct
- 794 Excelso Ct
- 43525 Vista Del Mar
- 43517 Excelso Dr
- 43480 Vista Del Mar
- 43490 Vista Del Mar
- 43470 Vista Del Mar
- 1074 Ocaso Camino
- 1082 Ocaso Camino
- 43520 Vista Del Mar
Your Personal Tour Guide
Ask me questions while you tour the home.