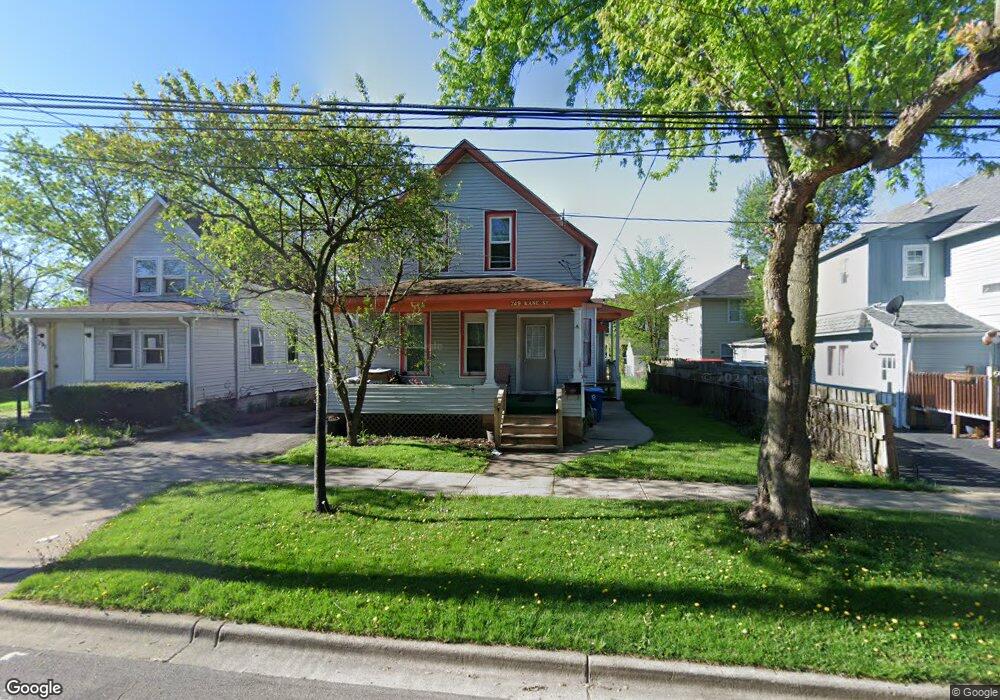
749 Kane St Aurora, IL 60505
McCarty Burlington NeighborhoodEstimated Value: $213,841 - $252,000
Studio
--
Bath
1,396
Sq Ft
$165/Sq Ft
Est. Value
About This Home
This home is located at 749 Kane St, Aurora, IL 60505 and is currently estimated at $230,210, approximately $164 per square foot. 749 Kane St is a home located in Kane County with nearby schools including Edna Rollins Elementary School, Simmons Middle School, and East Aurora High School.
Ownership History
Date
Name
Owned For
Owner Type
Purchase Details
Closed on
Jan 5, 2026
Sold by
Galvan Esteban R and Celaya Julieta Ojeda
Bought by
Galvan Esteban R and Celaya Julieta Ojeda
Current Estimated Value
Purchase Details
Closed on
Jun 3, 1998
Sold by
Merchants National Bank Of Aurora
Bought by
Galvan Esteban A and Ojeda Elen
Home Financials for this Owner
Home Financials are based on the most recent Mortgage that was taken out on this home.
Original Mortgage
$94,376
Interest Rate
7.22%
Mortgage Type
FHA
Purchase Details
Closed on
Jan 30, 1998
Sold by
Barr Paul W and Barr Mary E
Bought by
The Merchants National Bank Of Aurora and Trust #4231
Create a Home Valuation Report for This Property
The Home Valuation Report is an in-depth analysis detailing your home's value as well as a comparison with similar homes in the area
Home Values in the Area
Average Home Value in this Area
Purchase History
| Date | Buyer | Sale Price | Title Company |
|---|---|---|---|
| Galvan Esteban R | -- | Chicago Title Insurance Compan | |
| Galvan Esteban A | $95,000 | Law Title Insurance Co Inc | |
| The Merchants National Bank Of Aurora | $21,000 | Law Title Ins Co |
Source: Public Records
Mortgage History
| Date | Status | Borrower | Loan Amount |
|---|---|---|---|
| Previous Owner | Galvan Esteban A | $94,376 |
Source: Public Records
Tax History
| Year | Tax Paid | Tax Assessment Tax Assessment Total Assessment is a certain percentage of the fair market value that is determined by local assessors to be the total taxable value of land and additions on the property. | Land | Improvement |
|---|---|---|---|---|
| 2024 | $4,142 | $60,428 | $6,583 | $53,845 |
| 2023 | $4,035 | $53,992 | $5,882 | $48,110 |
| 2022 | $3,743 | $49,263 | $5,367 | $43,896 |
| 2021 | $3,529 | $43,708 | $4,997 | $38,711 |
| 2020 | $3,376 | $40,598 | $4,641 | $35,957 |
| 2019 | $3,724 | $42,264 | $4,300 | $37,964 |
| 2018 | $3,476 | $38,179 | $3,977 | $34,202 |
| 2017 | $3,244 | $33,075 | $3,664 | $29,411 |
| 2016 | $2,975 | $28,271 | $3,141 | $25,130 |
| 2015 | -- | $26,215 | $2,701 | $23,514 |
| 2014 | -- | $25,097 | $2,482 | $22,615 |
| 2013 | -- | $29,309 | $2,372 | $26,937 |
Source: Public Records
Map
Nearby Homes
Your Personal Tour Guide
Ask me questions while you tour the home.