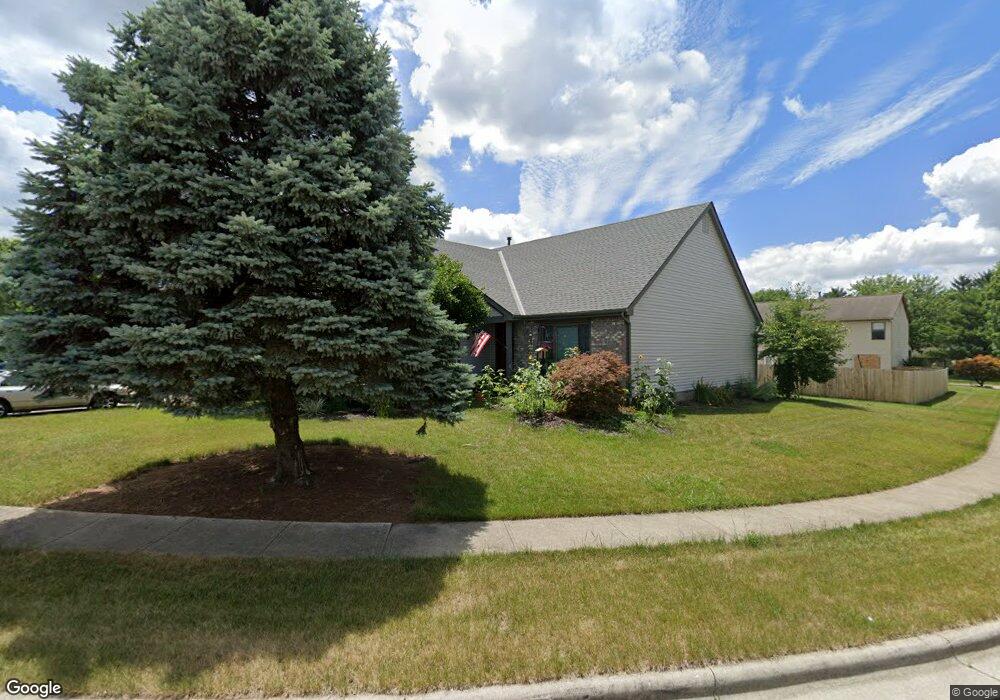
749 Schyler Ct Columbus, OH 43230
Gahanna-Havens Corners NeighborhoodEstimated Value: $353,555 - $363,000
4
Beds
3
Baths
1,740
Sq Ft
$206/Sq Ft
Est. Value
About This Home
This home is located at 749 Schyler Ct, Columbus, OH 43230 and is currently estimated at $358,139, approximately $205 per square foot. 749 Schyler Ct is a home located in Franklin County with nearby schools including Lincoln Elementary School, Gahanna South Middle School, and Lincoln High School.
Ownership History
Date
Name
Owned For
Owner Type
Purchase Details
Closed on
Dec 29, 2017
Sold by
Blamer Christopher A and Windland Kris A
Bought by
Yanno Albert R and Yanno Paris L
Current Estimated Value
Home Financials for this Owner
Home Financials are based on the most recent Mortgage that was taken out on this home.
Original Mortgage
$184,410
Outstanding Balance
$155,541
Interest Rate
3.92%
Mortgage Type
New Conventional
Estimated Equity
$202,598
Purchase Details
Closed on
Sep 20, 2002
Sold by
Joshua Investment Company
Bought by
Blamer Christopher A and Windland Kris A
Home Financials for this Owner
Home Financials are based on the most recent Mortgage that was taken out on this home.
Original Mortgage
$189,990
Interest Rate
6.32%
Mortgage Type
FHA
Purchase Details
Closed on
Jun 21, 2002
Sold by
S & J Real Estate Investment Co Ltd
Bought by
Joshua Investment Company
Create a Home Valuation Report for This Property
The Home Valuation Report is an in-depth analysis detailing your home's value as well as a comparison with similar homes in the area
Home Values in the Area
Average Home Value in this Area
Purchase History
| Date | Buyer | Sale Price | Title Company |
|---|---|---|---|
| Yanno Albert R | $204,900 | Great American Title | |
| Blamer Christopher A | $191,600 | Hummel Title Agency | |
| Joshua Investment Company | $31,000 | Northwest Title |
Source: Public Records
Mortgage History
| Date | Status | Borrower | Loan Amount |
|---|---|---|---|
| Open | Yanno Albert R | $184,410 | |
| Previous Owner | Blamer Christopher A | $189,990 |
Source: Public Records
Tax History Compared to Growth
Tax History
| Year | Tax Paid | Tax Assessment Tax Assessment Total Assessment is a certain percentage of the fair market value that is determined by local assessors to be the total taxable value of land and additions on the property. | Land | Improvement |
|---|---|---|---|---|
| 2024 | $5,777 | $111,620 | $31,960 | $79,660 |
| 2023 | $5,931 | $111,615 | $31,955 | $79,660 |
| 2022 | $4,165 | $68,040 | $13,650 | $54,390 |
| 2021 | $4,188 | $68,040 | $13,650 | $54,390 |
| 2020 | $4,162 | $68,040 | $13,650 | $54,390 |
| 2019 | $3,725 | $56,360 | $11,380 | $44,980 |
| 2018 | $3,745 | $56,360 | $11,380 | $44,980 |
| 2017 | $3,838 | $56,360 | $11,380 | $44,980 |
| 2016 | $3,808 | $54,780 | $11,340 | $43,440 |
| 2015 | $3,747 | $54,780 | $11,340 | $43,440 |
| 2014 | $3,791 | $54,780 | $11,340 | $43,440 |
| 2013 | $1,887 | $54,775 | $11,340 | $43,435 |
Source: Public Records
Map
Nearby Homes
- 349 Helmbright Dr
- 555 Chadwood Dr
- 745 Fleetrun Ave
- 107 Kinder Place
- 321 Flint Ridge Dr
- 1252 Rice Ave
- 249 Farm Creek Dr
- 488 Three Oaks Ct Unit 488
- 148 Sierra Dr
- 183 Serran Dr
- 970 Claycraft Rd
- 135 Serran Dr
- 219 N Hamilton Rd
- 3311 Longstreth Park Place
- 875 Taylor Station Rd
- 1391 Windrush Cir
- 5986 Stratton Place
- 3005 Souder Dr
- 206 Lintner St
- 477 Stratshire Ln
- 737 Schyler Ct
- 743 Schyler Ct
- 729 Schyler Ct
- 725 Schyler Ct
- 750 Schyler Ct
- 744 Schyler Ct
- 754 Schyler Ct
- 756 Schyler Ct
- 738 Schyler Ct
- 728 Schyler Ct
- 733 Schyler Ct
- 422 Schyler Way
- 418 Schyler Way
- 730 Schyler Ct
- 426 Schyler Way
- 716 Schyler Ct
- 732 Schyler Ct
- 712 Schyler Ct
- 726 Schyler Ct
- 430 Schyler Way