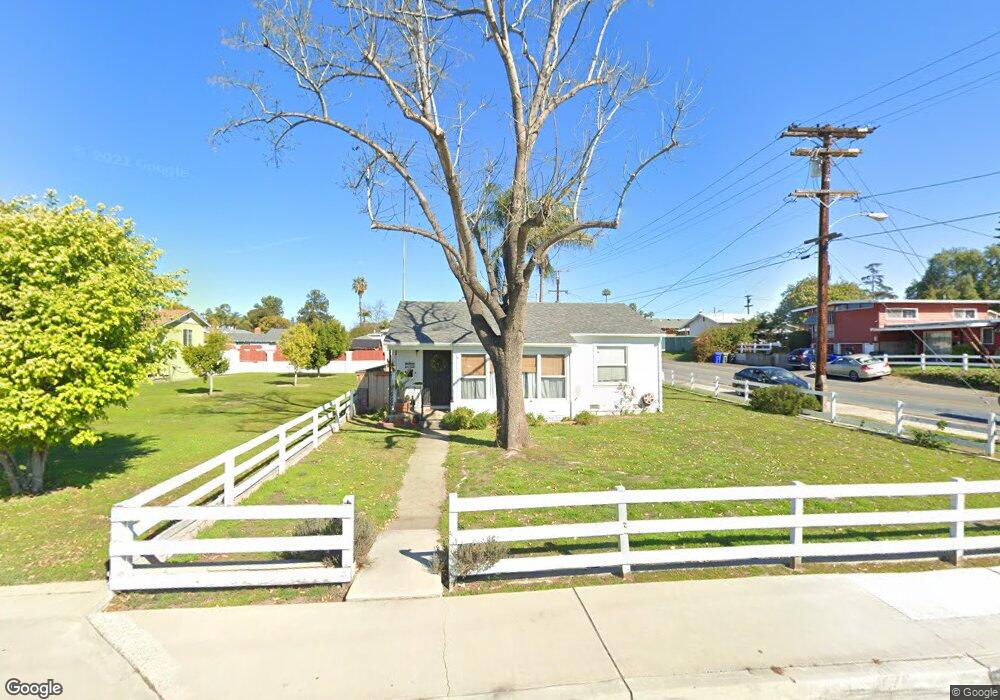
7496 San Miguel Ave Lemon Grove, CA 91945
Estimated Value: $664,000 - $735,000
2
Beds
1
Bath
944
Sq Ft
$742/Sq Ft
Est. Value
About This Home
This home is located at 7496 San Miguel Ave, Lemon Grove, CA 91945 and is currently estimated at $700,294, approximately $741 per square foot. 7496 San Miguel Ave is a home located in San Diego County with nearby schools including San Miguel Elementary School, Mount Miguel High School, and Helix High School.
Ownership History
Date
Name
Owned For
Owner Type
Purchase Details
Closed on
Mar 10, 2020
Sold by
Pierce Charlotte
Bought by
Pierce Charlotte and Little Brandon
Current Estimated Value
Home Financials for this Owner
Home Financials are based on the most recent Mortgage that was taken out on this home.
Original Mortgage
$290,000
Outstanding Balance
$256,347
Interest Rate
3.4%
Mortgage Type
New Conventional
Estimated Equity
$443,947
Purchase Details
Closed on
Oct 28, 2010
Sold by
Baxter Jeffrey Eugene and Baxter Ronda Lee
Bought by
Pierce Charlotte
Home Financials for this Owner
Home Financials are based on the most recent Mortgage that was taken out on this home.
Original Mortgage
$206,292
Interest Rate
4.25%
Mortgage Type
FHA
Purchase Details
Closed on
Nov 12, 1993
Sold by
Taylor William Frank
Bought by
Baxter Jeffrey Eugene and Baxter Ronda Lee
Home Financials for this Owner
Home Financials are based on the most recent Mortgage that was taken out on this home.
Original Mortgage
$114,000
Interest Rate
6.85%
Create a Home Valuation Report for This Property
The Home Valuation Report is an in-depth analysis detailing your home's value as well as a comparison with similar homes in the area
Home Values in the Area
Average Home Value in this Area
Purchase History
| Date | Buyer | Sale Price | Title Company |
|---|---|---|---|
| Pierce Charlotte | -- | First American Title Ins Co | |
| Pierce Charlotte | $215,000 | Lawyers Title | |
| Baxter Jeffrey Eugene | $120,000 | United Title Company |
Source: Public Records
Mortgage History
| Date | Status | Borrower | Loan Amount |
|---|---|---|---|
| Open | Pierce Charlotte | $290,000 | |
| Closed | Pierce Charlotte | $206,292 | |
| Previous Owner | Baxter Jeffrey Eugene | $114,000 |
Source: Public Records
Tax History Compared to Growth
Tax History
| Year | Tax Paid | Tax Assessment Tax Assessment Total Assessment is a certain percentage of the fair market value that is determined by local assessors to be the total taxable value of land and additions on the property. | Land | Improvement |
|---|---|---|---|---|
| 2025 | $3,854 | $275,444 | $124,268 | $151,176 |
| 2024 | $3,854 | $270,044 | $121,832 | $148,212 |
| 2023 | $3,761 | $264,750 | $119,444 | $145,306 |
| 2022 | $3,741 | $259,559 | $117,102 | $142,457 |
| 2021 | $3,693 | $254,470 | $114,806 | $139,664 |
| 2020 | $3,647 | $251,861 | $113,629 | $138,232 |
| 2019 | $3,586 | $246,923 | $111,401 | $135,522 |
| 2018 | $3,504 | $242,082 | $109,217 | $132,865 |
| 2017 | $150 | $237,336 | $107,076 | $130,260 |
| 2016 | $3,322 | $232,683 | $104,977 | $127,706 |
| 2015 | $3,303 | $229,189 | $103,401 | $125,788 |
| 2014 | $3,178 | $224,700 | $101,376 | $123,324 |
Source: Public Records
Map
Nearby Homes
- 2618 Sheri Ln
- 8122 8124 Lincoln St
- 2841 2843 Crane
- 1913 1919 Ensenada St
- 2760 Buena Vista Ave
- 2780 Buena Vista Ave
- 2985 New Jersey Ave
- 2542 Glebe Rd
- 3150-52 New Jersey Ave
- 7505-7 Mount Vernon St
- 3015 Olive St
- 2673 Massachusetts Ave
- 7442 Daytona St
- 3173 Vista Ave
- 3144 Vista Ave
- 7824 Deborah Place
- 2256 El Prado Ave
- 3246 Citrus St
- 2363 Mcknight Dr
- 2745 Mercury Dr
- 2725 New Jersey Ave
- 7480 San Miguel Ave Unit 82
- 7514 San Miguel Ave
- 2755 New Jersey Ave
- 7485 San Miguel Ave
- 2790 New Jersey Ave Unit 92
- 2634 Sheri Ln
- 7475 San Miguel Ave
- 7505 Cuyamaca Ave
- 7520 San Miguel Ave
- 7464 San Miguel Ave
- 7465 San Miguel Ave
- 7433 Ida St
- 2626 Sheri Ln
- 7528 San Miguel Ave
- 7522 San Miguel
- 7455 San Miguel Ave
- 7474 Tracy St
- 7525 Cuyamaca Ave
- 7454 San Miguel Ave