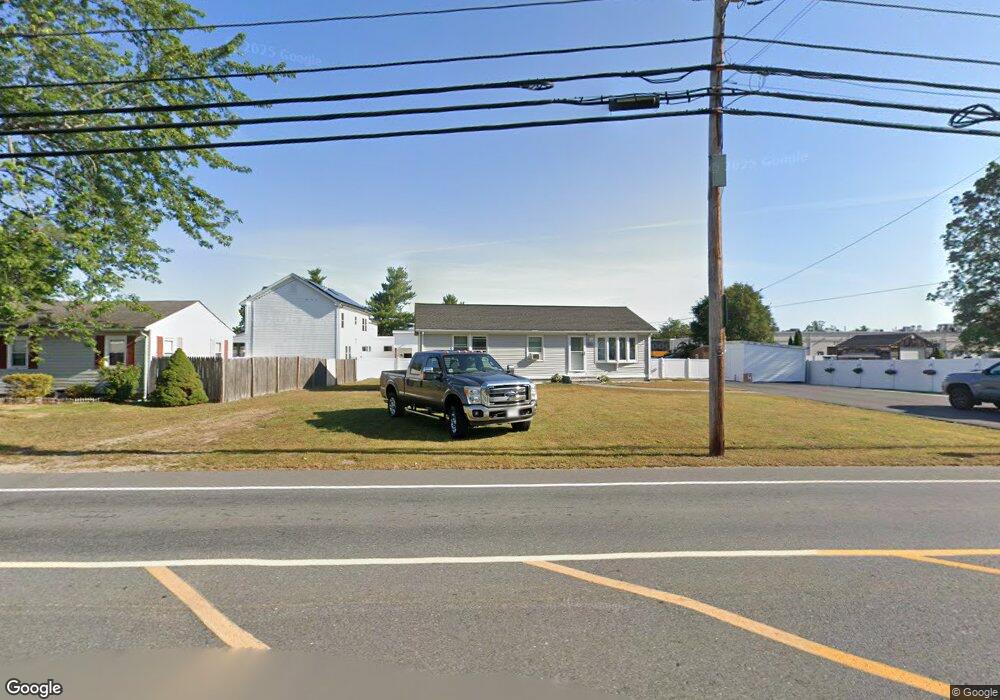
75 1/2 Pine Hill Rd Nashua, NH 03063
Northwest Nashua NeighborhoodEstimated Value: $454,000 - $545,000
3
Beds
2
Baths
1,008
Sq Ft
$499/Sq Ft
Est. Value
About This Home
This home is located at 75 1/2 Pine Hill Rd, Nashua, NH 03063 and is currently estimated at $503,156, approximately $499 per square foot. 75 1/2 Pine Hill Rd is a home located in Hillsborough County with nearby schools including Birch Hill Elementary School, Elm Street Middle School, and Nashua High School North.
Ownership History
Date
Name
Owned For
Owner Type
Purchase Details
Closed on
Aug 15, 2022
Sold by
Rodrigues Helton M and Rodrigues Mariana B
Bought by
Queiroz Daniel S and Donega Bruna
Current Estimated Value
Home Financials for this Owner
Home Financials are based on the most recent Mortgage that was taken out on this home.
Original Mortgage
$353,479
Outstanding Balance
$338,447
Interest Rate
5.7%
Mortgage Type
FHA
Estimated Equity
$164,709
Purchase Details
Closed on
Aug 14, 2019
Sold by
Montagnini Wagner and Montagnini Andreia
Bought by
Family Realty Inv Llc
Purchase Details
Closed on
Sep 25, 2009
Sold by
Brueckner Susan A
Bought by
Montagnini Wagner and Montagnini Andreia
Home Financials for this Owner
Home Financials are based on the most recent Mortgage that was taken out on this home.
Original Mortgage
$171,731
Interest Rate
5.31%
Mortgage Type
Purchase Money Mortgage
Create a Home Valuation Report for This Property
The Home Valuation Report is an in-depth analysis detailing your home's value as well as a comparison with similar homes in the area
Home Values in the Area
Average Home Value in this Area
Purchase History
| Date | Buyer | Sale Price | Title Company |
|---|---|---|---|
| Queiroz Daniel S | $360,000 | None Available | |
| Family Realty Inv Llc | -- | -- | |
| Montagnini Wagner | $10,900 | -- |
Source: Public Records
Mortgage History
| Date | Status | Borrower | Loan Amount |
|---|---|---|---|
| Open | Queiroz Daniel S | $353,479 | |
| Previous Owner | Montagnini Wagner | $171,731 | |
| Previous Owner | Montagnini Wagner | $9,800 | |
| Previous Owner | Montagnini Wagner | $225,000 |
Source: Public Records
Tax History Compared to Growth
Tax History
| Year | Tax Paid | Tax Assessment Tax Assessment Total Assessment is a certain percentage of the fair market value that is determined by local assessors to be the total taxable value of land and additions on the property. | Land | Improvement |
|---|---|---|---|---|
| 2024 | $6,470 | $406,900 | $166,100 | $240,800 |
| 2023 | $6,227 | $341,600 | $132,900 | $208,700 |
| 2022 | $6,173 | $341,600 | $132,900 | $208,700 |
| 2021 | $5,580 | $240,300 | $88,600 | $151,700 |
| 2020 | $5,413 | $239,400 | $88,600 | $150,800 |
| 2019 | $5,209 | $239,400 | $88,600 | $150,800 |
| 2018 | $5,203 | $245,300 | $94,500 | $150,800 |
| 2017 | $5,153 | $199,800 | $84,400 | $115,400 |
| 2016 | $5,009 | $199,800 | $84,400 | $115,400 |
| 2015 | $4,901 | $199,800 | $84,400 | $115,400 |
| 2014 | $4,805 | $199,800 | $84,400 | $115,400 |
Source: Public Records
Map
Nearby Homes
- 7 Robert Dr
- 19 Dunloggin Rd
- 74 Profile Cir
- 3 Wright Rd
- 123 Cannongate III
- 5 Chatfield Dr Unit U18
- 4 Jared Cir Unit U21
- 239 Broad St
- 33 Ferry Rd
- 30 Burgess St
- 11 Amherst Terrace
- 3 Paddington Place
- 31 Ashland St
- 17 Danbury Rd
- 38 Highbridge Hill Rd Unit 186
- 0 Baldwin St
- 7 Bitirnas St Unit U7
- 424 Broad St
- 36 Hampton Dr
- 26 Andover Down Unit 276
- 75 Pine Hill Rd
- 73 Pine Hill Rd
- 73 Pine Hill Rd
- 36 Charron Ave
- 3 Robert Dr
- 71 Pine Hill Rd
- 76 Pine Hill Rd
- 5 Robert Dr
- 78 Pine Hill Rd
- 3 Bud Way
- 3 Bud Way
- 3 Bud Way Units 29-30
- 3 Bud Way 29-30 - W 030
- 3 Bud Way Unit 29-30-W030
- 3 Bud Way Unit 29-39-C 092
- 3 Bud Way Unit 17 W120
- 3 Bud Way Unit 17
- 3 Bud Way Unit 24
- 3 Bud Way Unit 27
- 3 Bud Way