
Seller's Agent in 2019
John O'Malley
O'MALLEY REAL ESTATE INC
(904) 502-9406
3 in this area
56 Total Sales


Estimated Value: $426,000 - $672,000
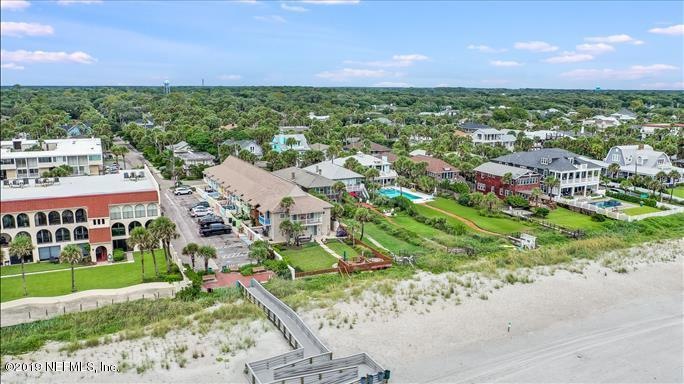
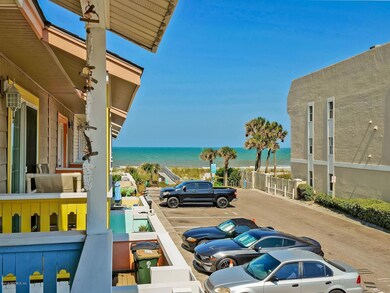
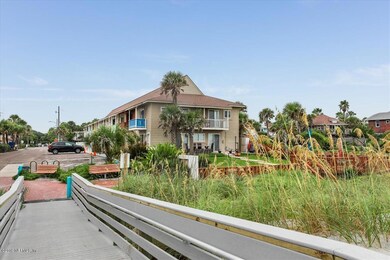
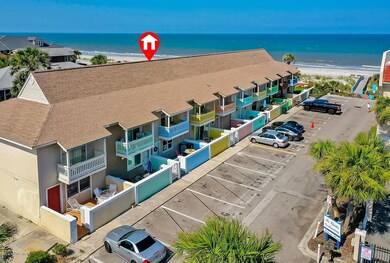
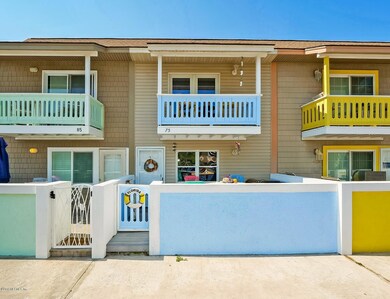
Life's a Beach when you live here! Just steps to the ocean, this townhouse is move-in ready. Freshly painted interior, new plush carpet and upgraded padding upstairs. Tile down. Updated kitchen and remodeled master bath. Newer systems: HVAC (2018), washer/dryer, and water heater. Watch the waves as you relax on your private balcony. Spacious patio deck is perfect for entertaining. One assigned parking space plus public parking. No HOA or HOA fees. No one to tell you what you can and can't do to your home! Freedom to enjoy fully your home and community. It doesn't get any better than this!
Last Agent to Sell the Property
O'MALLEY REAL ESTATE INC License #0590875 Listed on: 07/15/2019
| Date | Buyer | Sale Price | Title Company |
|---|---|---|---|
| Bradshaw Cate Terrie L | $370,000 | Attorney |
| Date | Status | Borrower | Loan Amount |
|---|---|---|---|
| Open | Bradshaw Cate Terrie L | $362,280 |
| Date | Event | Price | List to Sale | Price per Sq Ft |
|---|---|---|---|---|
| 12/17/2023 12/17/23 | Off Market | $370,000 | -- | -- |
| 10/02/2019 10/02/19 | Sold | $370,000 | -5.1% | $340 / Sq Ft |
| 09/29/2019 09/29/19 | Pending | -- | -- | -- |
| 07/15/2019 07/15/19 | For Sale | $389,900 | -- | $358 / Sq Ft |
| Year | Tax Paid | Tax Assessment Tax Assessment Total Assessment is a certain percentage of the fair market value that is determined by local assessors to be the total taxable value of land and additions on the property. | Land | Improvement |
|---|---|---|---|---|
| 2026 | $4,990 | $336,337 | -- | -- |
| 2025 | $4,893 | $336,337 | -- | -- |
| 2024 | $4,753 | $326,859 | -- | -- |
| 2023 | $4,753 | $317,339 | $161,568 | $155,771 |
| 2022 | $4,707 | $321,847 | $0 | $0 |
| 2021 | $4,714 | $312,473 | $240,000 | $72,473 |
| 2020 | $4,692 | $309,514 | $240,000 | $69,514 |
| 2019 | $4,796 | $269,407 | $200,000 | $69,407 |
| 2018 | $4,817 | $268,200 | $200,000 | $68,200 |
| 2017 | $4,906 | $269,995 | $200,000 | $69,995 |
| 2016 | $4,939 | $266,923 | $0 | $0 |
| 2015 | $4,936 | $260,731 | $0 | $0 |
| 2014 | $4,544 | $237,449 | $0 | $0 |
Seller's Agent in 2019
John O'Malley
O'MALLEY REAL ESTATE INC
(904) 502-9406
3 in this area
56 Total Sales
Buyer's Agent in 2019
RICHARD OLIVER
EXP REALTY LLC
(904) 626-5428
30 Total Sales
Source: realMLS (Northeast Florida Multiple Listing Service)
MLS Number: 998127
APN: 170263-0030
Disclaimer: Certain information contained herein is derived from information provided by parties other than Homes.com. All information provided is deemed reliable, but is not guaranteed to be accurate and should be independently verified.
![]() IDX information is provided exclusively for personal, non-commercial use, and may not be used for any purpose other than to identify prospective properties consumers may be interested in purchasing. Data is deemed reliable but is not guaranteed accurate by NEFMLS.
IDX information is provided exclusively for personal, non-commercial use, and may not be used for any purpose other than to identify prospective properties consumers may be interested in purchasing. Data is deemed reliable but is not guaranteed accurate by NEFMLS.
Ask me questions while you tour the home.