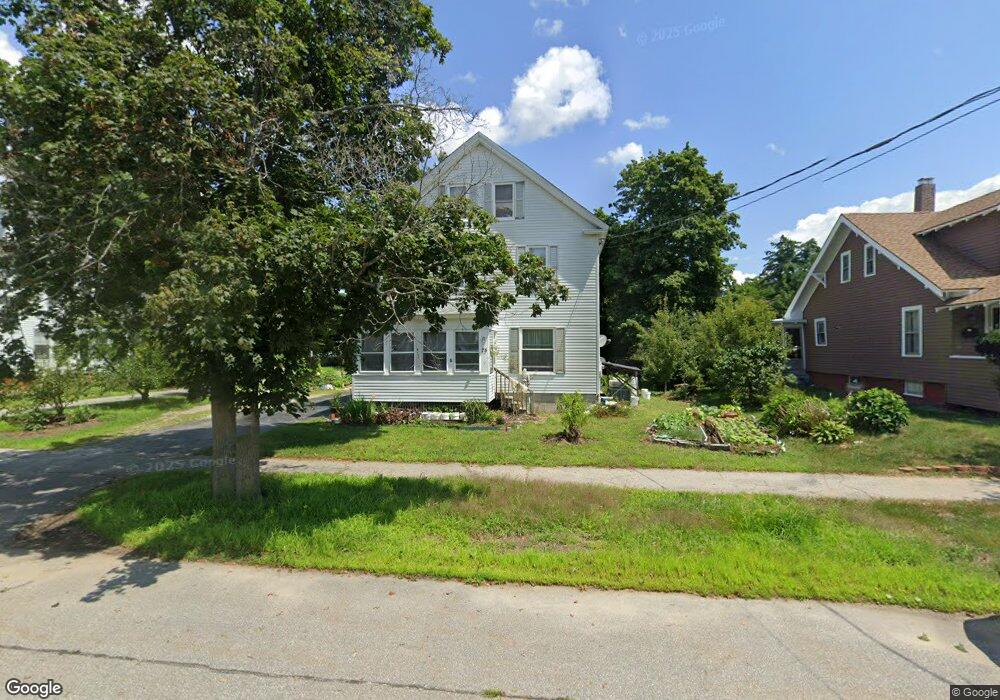
75 Broadway Concord, NH 03301
South End NeighborhoodEstimated Value: $484,000 - $581,000
3
Beds
3
Baths
2,100
Sq Ft
$247/Sq Ft
Est. Value
About This Home
This home is located at 75 Broadway, Concord, NH 03301 and is currently estimated at $518,450, approximately $246 per square foot. 75 Broadway is a home located in Merrimack County with nearby schools including Abbot-Downing School, Rundlett Middle School, and Concord High School.
Ownership History
Date
Name
Owned For
Owner Type
Purchase Details
Closed on
Mar 28, 2001
Sold by
Thompson Howard C and Thompson Paula L
Bought by
Diep Lam T
Current Estimated Value
Home Financials for this Owner
Home Financials are based on the most recent Mortgage that was taken out on this home.
Original Mortgage
$80,000
Outstanding Balance
$27,539
Interest Rate
6.96%
Mortgage Type
Purchase Money Mortgage
Estimated Equity
$490,911
Create a Home Valuation Report for This Property
The Home Valuation Report is an in-depth analysis detailing your home's value as well as a comparison with similar homes in the area
Home Values in the Area
Average Home Value in this Area
Purchase History
| Date | Buyer | Sale Price | Title Company |
|---|---|---|---|
| Diep Lam T | $150,000 | -- |
Source: Public Records
Mortgage History
| Date | Status | Borrower | Loan Amount |
|---|---|---|---|
| Open | Diep Lam T | $80,000 |
Source: Public Records
Tax History
| Year | Tax Paid | Tax Assessment Tax Assessment Total Assessment is a certain percentage of the fair market value that is determined by local assessors to be the total taxable value of land and additions on the property. | Land | Improvement |
|---|---|---|---|---|
| 2025 | $8,975 | $308,300 | $109,100 | $199,200 |
| 2024 | $8,537 | $308,300 | $109,100 | $199,200 |
| 2023 | $8,281 | $308,300 | $109,100 | $199,200 |
| 2022 | $7,982 | $308,300 | $109,100 | $199,200 |
| 2021 | $7,792 | $310,200 | $109,100 | $201,100 |
| 2020 | $7,629 | $285,100 | $87,200 | $197,900 |
| 2019 | $7,112 | $256,000 | $85,500 | $170,500 |
| 2018 | $6,907 | $245,000 | $85,500 | $159,500 |
| 2017 | $6,588 | $233,300 | $85,500 | $147,800 |
| 2016 | $6,248 | $225,800 | $83,900 | $141,900 |
| 2015 | $5,900 | $212,900 | $87,500 | $125,400 |
| 2014 | $5,708 | $212,900 | $87,500 | $125,400 |
| 2013 | -- | $212,900 | $87,500 | $125,400 |
| 2012 | -- | $218,200 | $87,500 | $130,700 |
Source: Public Records
Map
Nearby Homes
- 0 South St Unit 4969509
- 273-279 S Main St
- 335 S Main St
- 47 Noyes St
- 33 Joffre St
- 47 South St
- 111 -113 South Main St
- 40 Nivelle St
- 58 S State St
- 289 South St
- 7-9 Myrtle St
- 30 Longmeadow Dr
- 25 N Spring St
- 22 Fairfield Dr
- 21 Fairfield Dr
- 20 Fairfield Dr
- 9 Forest St
- 135 Liberty St
- 15 Wyman St Unit 9
- 19 Grappone Dr
Your Personal Tour Guide
Ask me questions while you tour the home.