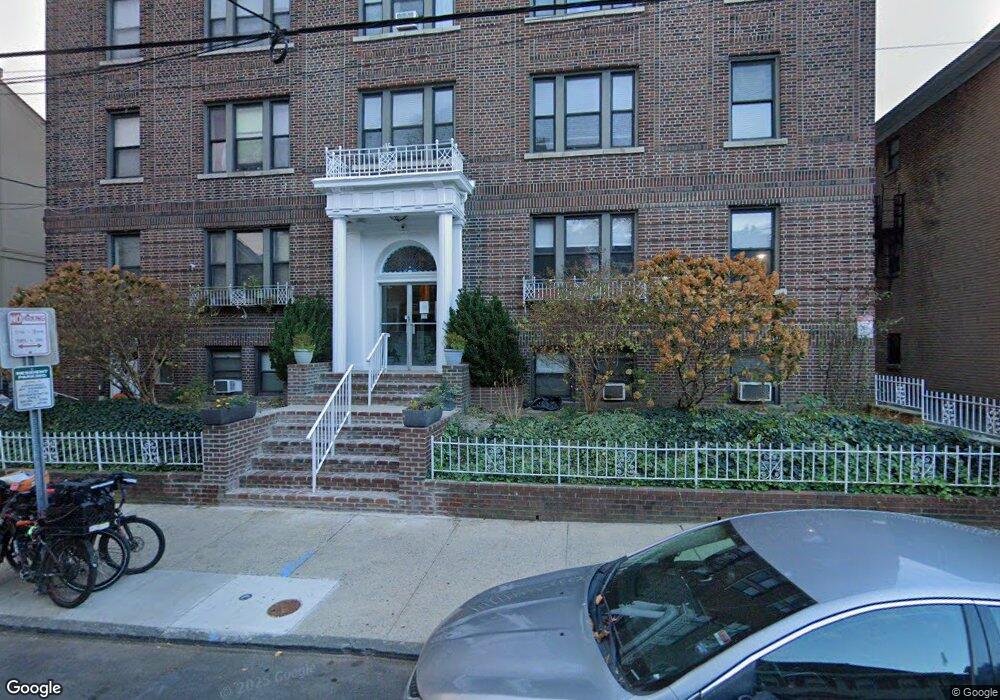
75 Fairview Ave Unit 40 Jersey City, NJ 07304
West Side NeighborhoodEstimated Value: $361,752 - $398,000
2
Beds
--
Bath
1,057
Sq Ft
$353/Sq Ft
Est. Value
About This Home
This home is located at 75 Fairview Ave Unit 40, Jersey City, NJ 07304 and is currently estimated at $373,188, approximately $353 per square foot. 75 Fairview Ave Unit 40 is a home located in Hudson County with nearby schools including Joseph H. Brensinger No. 17 Elementary School, Lincoln High School, and Liberty High School.
Ownership History
Date
Name
Owned For
Owner Type
Purchase Details
Closed on
Jun 19, 2007
Sold by
Aurelio Bernard and Aurelio Shawn
Bought by
Rippey Branden C
Current Estimated Value
Home Financials for this Owner
Home Financials are based on the most recent Mortgage that was taken out on this home.
Original Mortgage
$210,000
Outstanding Balance
$129,884
Interest Rate
6.39%
Mortgage Type
Purchase Money Mortgage
Estimated Equity
$243,304
Purchase Details
Closed on
May 1, 2003
Sold by
Frederick A Soule Corp
Bought by
Aurelio Bernard
Home Financials for this Owner
Home Financials are based on the most recent Mortgage that was taken out on this home.
Original Mortgage
$130,000
Interest Rate
7%
Mortgage Type
Seller Take Back
Create a Home Valuation Report for This Property
The Home Valuation Report is an in-depth analysis detailing your home's value as well as a comparison with similar homes in the area
Home Values in the Area
Average Home Value in this Area
Purchase History
| Date | Buyer | Sale Price | Title Company |
|---|---|---|---|
| Rippey Branden C | $280,000 | Fidelity Natl Title Ins Co | |
| Aurelio Bernard | $130,000 | Vested Title Inc |
Source: Public Records
Mortgage History
| Date | Status | Borrower | Loan Amount |
|---|---|---|---|
| Open | Rippey Branden C | $210,000 | |
| Previous Owner | Aurelio Bernard | $130,000 |
Source: Public Records
Tax History Compared to Growth
Tax History
| Year | Tax Paid | Tax Assessment Tax Assessment Total Assessment is a certain percentage of the fair market value that is determined by local assessors to be the total taxable value of land and additions on the property. | Land | Improvement |
|---|---|---|---|---|
| 2025 | $6,214 | $278,300 | $60,000 | $218,300 |
| 2024 | $6,253 | $278,300 | $60,000 | $218,300 |
| 2023 | $6,253 | $278,300 | $60,000 | $218,300 |
| 2022 | $5,894 | $278,300 | $60,000 | $218,300 |
| 2021 | $4,464 | $278,300 | $60,000 | $218,300 |
| 2020 | $4,481 | $278,300 | $60,000 | $218,300 |
| 2019 | $4,286 | $278,300 | $60,000 | $218,300 |
| 2018 | $1,180 | $278,300 | $60,000 | $218,300 |
| 2017 | $6,185 | $79,300 | $1,400 | $77,900 |
| 2016 | $6,107 | $79,300 | $1,400 | $77,900 |
| 2015 | $5,933 | $79,300 | $1,400 | $77,900 |
| 2014 | $5,895 | $79,300 | $1,400 | $77,900 |
Source: Public Records
Map
Nearby Homes
- 25 Duncan Ave Unit 210
- 673 Bergen Ave Unit 7001
- 53 Duncan Ave
- 53 Duncan Ave Unit 31
- 53 Duncan Ave Unit 2
- 2520 John F. Kennedy Blvd
- 2520 John F. Kennedy Blvd Unit 1C
- 2520 John F. Kennedy Blvd Unit 2C
- 2520 Kennedy Blvd Unit 1C
- 2520 Kennedy Blvd Unit 1B
- 53 Kensington Ave
- 2600 John F. Kennedy Blvd Unit 5B
- 2600 John F. Kennedy Blvd Unit 10B
- 2600 John F. Kennedy Blvd Unit 7A
- 2600 John F. Kennedy Blvd Unit 2C
- 2600 John F. Kennedy Blvd Unit 7F
- 258 Fairmount Ave
- 2600 Kennedy Blvd Unit 10b
- 2600 Kennedy Blvd Unit 6C
- 2600 Kennedy Blvd Unit 1G
- 75 Fairview Ave
- 75 Fairview Ave
- 75 Fairview Ave
- 75 Fairview Ave
- 75 Fairview Ave
- 75 Fairview Ave
- 75 Fairview Ave
- 75 Fairview Ave Unit B3
- 75 Fairview Ave Unit 32
- 75 Fairview Ave Unit B4
- 75 Fairview Ave Unit B1
- 75 Fairview Ave Unit 16
- 75 Fairview Ave Unit 44
- 75 Fairview Ave
- 75 Fairview Ave Unit 22
- 75 Fairview Ave Unit 14
- 75 Fairview Ave Unit 34
- 75 Fairview Ave Unit 42
- 75 Fairview Ave Unit 20
- 75 Fairview Ave