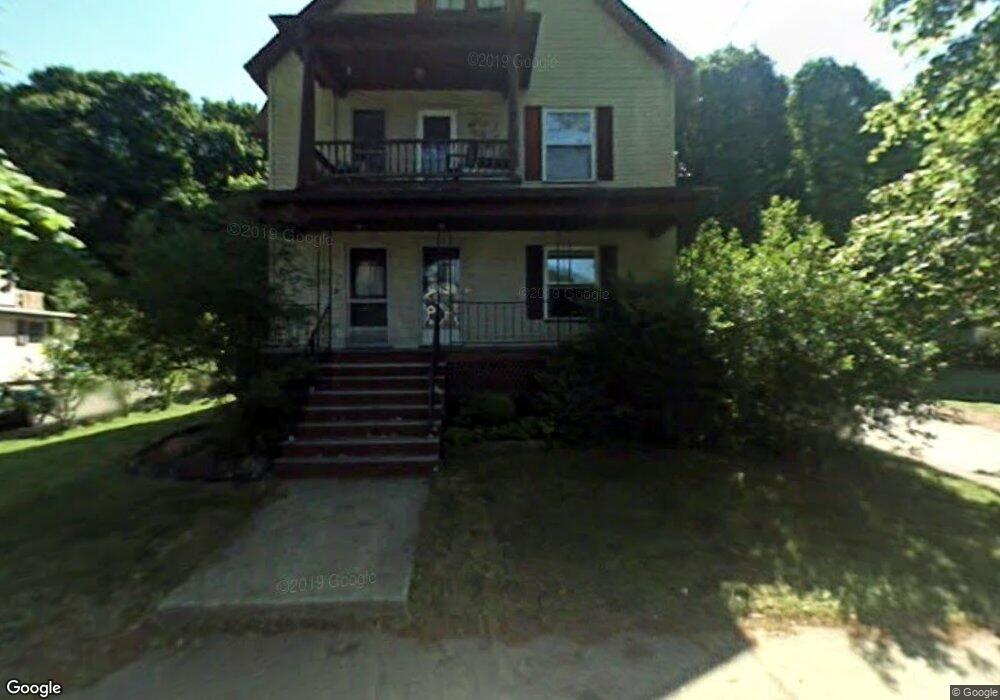
75 Manning St Hudson, MA 01749
Downtown Hudson NeighborhoodEstimated Value: $704,000 - $818,461
6
Beds
2
Baths
2,836
Sq Ft
$268/Sq Ft
Est. Value
About This Home
This home is located at 75 Manning St, Hudson, MA 01749 and is currently estimated at $760,115, approximately $268 per square foot. 75 Manning St is a home located in Middlesex County with nearby schools including David J. Quinn Middle School, Hudson High School, and First Steps Children's Center.
Ownership History
Date
Name
Owned For
Owner Type
Purchase Details
Closed on
Feb 25, 2005
Sold by
75-77 Manning St Rt and Kane
Bought by
Tary Anna K
Current Estimated Value
Home Financials for this Owner
Home Financials are based on the most recent Mortgage that was taken out on this home.
Original Mortgage
$384,750
Outstanding Balance
$196,607
Interest Rate
5.73%
Mortgage Type
Purchase Money Mortgage
Estimated Equity
$563,508
Purchase Details
Closed on
Mar 22, 2002
Sold by
Jagling William C
Bought by
75-77 Manning St T and Kane
Home Financials for this Owner
Home Financials are based on the most recent Mortgage that was taken out on this home.
Original Mortgage
$171,000
Interest Rate
6.91%
Mortgage Type
Purchase Money Mortgage
Create a Home Valuation Report for This Property
The Home Valuation Report is an in-depth analysis detailing your home's value as well as a comparison with similar homes in the area
Home Values in the Area
Average Home Value in this Area
Purchase History
| Date | Buyer | Sale Price | Title Company |
|---|---|---|---|
| Tary Anna K | $405,000 | -- | |
| Tary Anna K | $405,000 | -- | |
| 75-77 Manning St T | $180,000 | -- | |
| 75 & 77 Manning St T | $180,000 | -- |
Source: Public Records
Mortgage History
| Date | Status | Borrower | Loan Amount |
|---|---|---|---|
| Open | Tary Anna K | $384,750 | |
| Closed | 75-77 Manning St T | $384,750 | |
| Previous Owner | 75 & 77 Manning St T | $171,000 |
Source: Public Records
Tax History Compared to Growth
Tax History
| Year | Tax Paid | Tax Assessment Tax Assessment Total Assessment is a certain percentage of the fair market value that is determined by local assessors to be the total taxable value of land and additions on the property. | Land | Improvement |
|---|---|---|---|---|
| 2025 | $8,232 | $593,100 | $171,500 | $421,600 |
| 2024 | $7,882 | $563,000 | $155,800 | $407,200 |
| 2023 | $8,068 | $552,600 | $149,900 | $402,700 |
| 2022 | $6,936 | $437,300 | $136,200 | $301,100 |
| 2021 | $6,419 | $386,900 | $129,800 | $257,100 |
| 2020 | $6,021 | $362,500 | $127,100 | $235,400 |
| 2019 | $6,073 | $356,600 | $127,100 | $229,500 |
| 2018 | $5,962 | $340,700 | $121,100 | $219,600 |
| 2017 | $5,345 | $305,400 | $115,400 | $190,000 |
| 2016 | $4,699 | $271,800 | $115,400 | $156,400 |
| 2015 | $4,920 | $284,900 | $115,400 | $169,500 |
| 2014 | $4,766 | $273,600 | $101,100 | $172,500 |
Source: Public Records
Map
Nearby Homes
- 248 Main St Unit 207
- 248 Main St Unit 216
- 74 Cox St Unit 9
- 65 Main St
- 16 Houghton St
- 1 Barracks Rd Unit 1
- 18-24 River St Unit 1
- 11 Barracks Rd Unit 11
- 9 Barracks Rd Unit 9
- 3 Barracks Rd Unit 3
- 7 Barracks Rd Unit 7
- 5 Barracks Rd Unit 5
- 104 Lincoln St
- 55 Cottage St
- 34 Forest Ave
- 200 Manning St Unit 6C
- 200 Manning St Unit 14B
- 17 School St Unit C
- 17 School St Unit A
- 133 Lincoln St