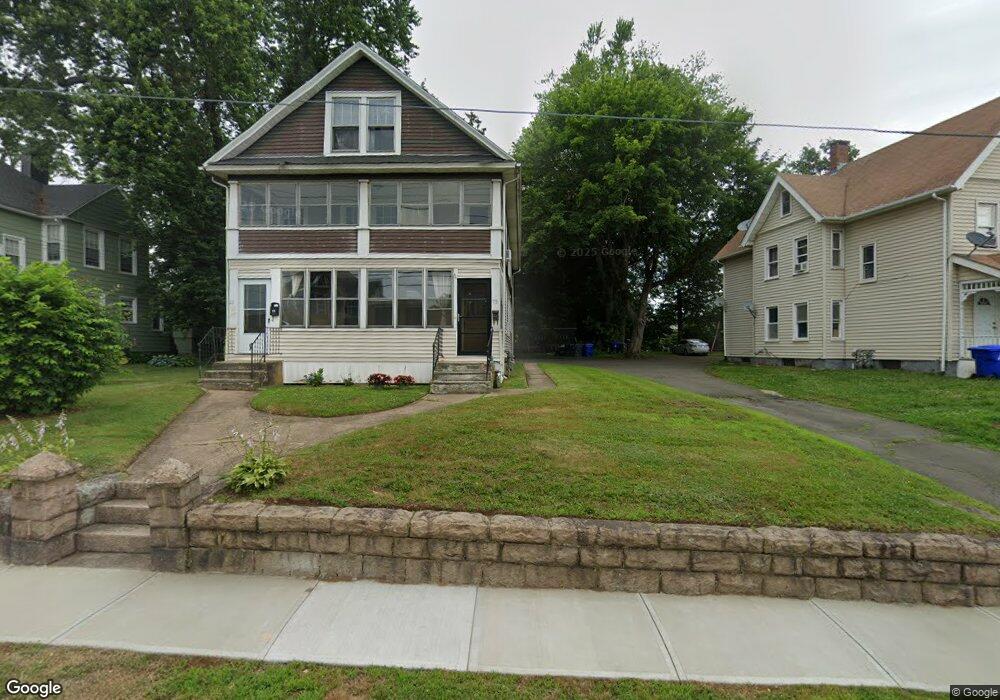
75 Maple St Unit 77 Branford, CT 06405
Estimated Value: $608,000 - $640,000
5
Beds
6
Baths
2,654
Sq Ft
$235/Sq Ft
Est. Value
About This Home
This home is located at 75 Maple St Unit 77, Branford, CT 06405 and is currently estimated at $624,830, approximately $235 per square foot. 75 Maple St Unit 77 is a home located in New Haven County with nearby schools including Francis Walsh Intermediate School, Branford High School, and East Shoreline Catholic Academy.
Ownership History
Date
Name
Owned For
Owner Type
Purchase Details
Closed on
Jul 27, 1994
Sold by
Ruggerio Peter L
Bought by
Simpson Howard E
Current Estimated Value
Home Financials for this Owner
Home Financials are based on the most recent Mortgage that was taken out on this home.
Original Mortgage
$138,713
Interest Rate
4.5%
Mortgage Type
Unknown
Purchase Details
Closed on
Jun 9, 1993
Sold by
Higley Earle D
Bought by
Falcigno Stephen P and Falcigno Loredana
Create a Home Valuation Report for This Property
The Home Valuation Report is an in-depth analysis detailing your home's value as well as a comparison with similar homes in the area
Home Values in the Area
Average Home Value in this Area
Purchase History
| Date | Buyer | Sale Price | Title Company |
|---|---|---|---|
| Simpson Howard E | $155,000 | -- | |
| Falcigno Stephen P | $175,000 | -- |
Source: Public Records
Mortgage History
| Date | Status | Borrower | Loan Amount |
|---|---|---|---|
| Open | Falcigno Stephen P | $140,000 | |
| Closed | Falcigno Stephen P | $134,000 | |
| Closed | Falcigno Stephen P | $138,713 | |
| Previous Owner | Falcigno Stephen P | $51,500 |
Source: Public Records
Tax History Compared to Growth
Tax History
| Year | Tax Paid | Tax Assessment Tax Assessment Total Assessment is a certain percentage of the fair market value that is determined by local assessors to be the total taxable value of land and additions on the property. | Land | Improvement |
|---|---|---|---|---|
| 2025 | $6,576 | $307,300 | $78,600 | $228,700 |
| 2024 | $6,538 | $214,500 | $66,400 | $148,100 |
| 2023 | $6,411 | $214,500 | $66,400 | $148,100 |
| 2022 | $6,317 | $214,500 | $66,400 | $148,100 |
| 2021 | $6,341 | $215,300 | $66,400 | $148,900 |
| 2020 | $6,226 | $215,300 | $66,400 | $148,900 |
| 2019 | $6,087 | $209,400 | $66,400 | $143,000 |
| 2018 | $5,997 | $209,400 | $66,400 | $143,000 |
| 2017 | $5,962 | $209,400 | $66,400 | $143,000 |
| 2016 | $5,740 | $209,400 | $66,400 | $143,000 |
| 2015 | $5,639 | $209,400 | $66,400 | $143,000 |
| 2014 | -- | $208,500 | $66,400 | $142,100 |
Source: Public Records
Map
Nearby Homes
- 60 Maple St Unit 40B
- 58 Quarry Dock Rd
- 74 Quarry Dock Rd
- 18 Linsley St
- 29 Harbour Village Unit D
- 26 N Main St Unit TRLR 19
- 21 Harbor St
- 10 Eli Yale Terrace
- 19 Stonegate Unit D
- 22 Montoya Dr Unit 2
- 25 S Montowese St
- 69 Montoya Dr
- 73 Briarwood Ln Unit E
- 60 Montoya Dr Unit 60
- 15 River Rd
- 16 Pine Orchard Rd Unit 23
- 33 Orchard Hill Rd
- 26 Cedar Knolls Dr
- 85 Ivy St
- 25 Florence Rd Unit 71