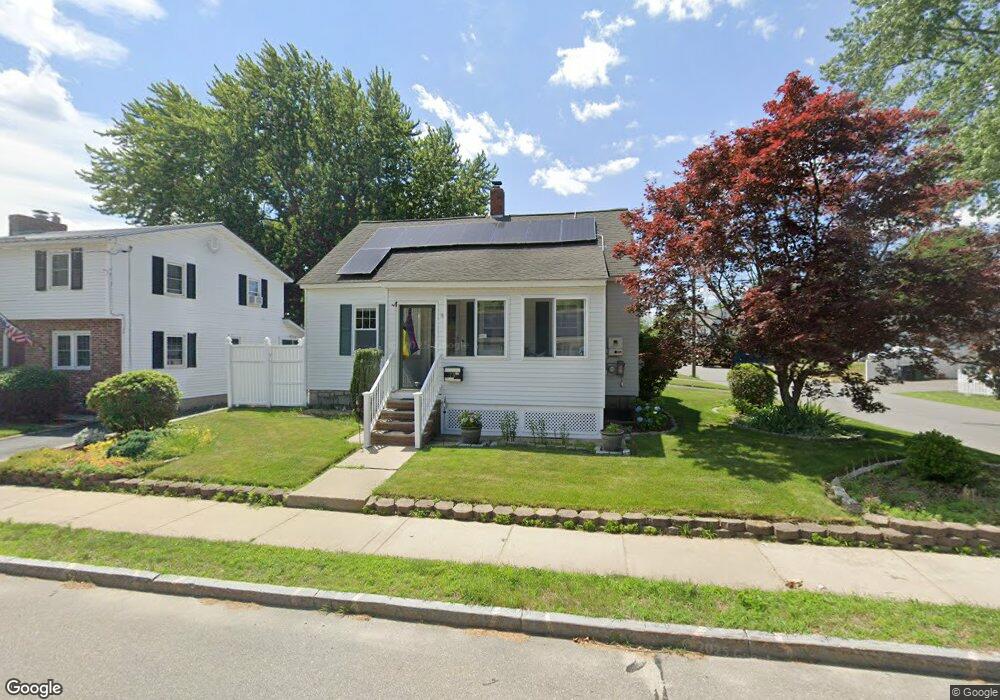
75 Marshall St Nashua, NH 03060
Downtown Nashua NeighborhoodEstimated Value: $365,000 - $431,000
2
Beds
1
Bath
1,075
Sq Ft
$385/Sq Ft
Est. Value
About This Home
This home is located at 75 Marshall St, Nashua, NH 03060 and is currently estimated at $413,486, approximately $384 per square foot. 75 Marshall St is a home located in Hillsborough County with nearby schools including Dr. Norman W. Crisp Elementary School, Elm Street Middle School, and Nashua High School North.
Ownership History
Date
Name
Owned For
Owner Type
Purchase Details
Closed on
Sep 16, 2016
Sold by
Coleman Richard O and Coleman Patricia A
Bought by
Cardenas Carlos H and Morales-Hoyos Teresa
Current Estimated Value
Home Financials for this Owner
Home Financials are based on the most recent Mortgage that was taken out on this home.
Original Mortgage
$200,305
Outstanding Balance
$159,996
Interest Rate
3.43%
Mortgage Type
FHA
Estimated Equity
$253,490
Purchase Details
Closed on
Dec 30, 1999
Sold by
Lawrence F Gauthier Rv
Bought by
Coleman Richard
Home Financials for this Owner
Home Financials are based on the most recent Mortgage that was taken out on this home.
Original Mortgage
$106,400
Interest Rate
7.71%
Mortgage Type
Purchase Money Mortgage
Create a Home Valuation Report for This Property
The Home Valuation Report is an in-depth analysis detailing your home's value as well as a comparison with similar homes in the area
Home Values in the Area
Average Home Value in this Area
Purchase History
| Date | Buyer | Sale Price | Title Company |
|---|---|---|---|
| Cardenas Carlos H | $204,000 | -- | |
| Coleman Richard | $112,000 | -- |
Source: Public Records
Mortgage History
| Date | Status | Borrower | Loan Amount |
|---|---|---|---|
| Open | Cardenas Carlos H | $200,305 | |
| Previous Owner | Coleman Richard | $118,300 | |
| Previous Owner | Coleman Richard | $106,400 |
Source: Public Records
Tax History Compared to Growth
Tax History
| Year | Tax Paid | Tax Assessment Tax Assessment Total Assessment is a certain percentage of the fair market value that is determined by local assessors to be the total taxable value of land and additions on the property. | Land | Improvement |
|---|---|---|---|---|
| 2024 | $6,242 | $392,600 | $137,700 | $254,900 |
| 2023 | $5,781 | $317,100 | $110,200 | $206,900 |
| 2022 | $5,730 | $317,100 | $110,200 | $206,900 |
| 2021 | $5,064 | $218,100 | $73,400 | $144,700 |
| 2020 | $4,897 | $216,600 | $73,400 | $143,200 |
| 2019 | $4,713 | $216,600 | $73,400 | $143,200 |
| 2018 | $4,594 | $216,600 | $73,400 | $143,200 |
| 2017 | $4,382 | $169,900 | $68,700 | $101,200 |
| 2016 | $4,259 | $169,900 | $68,700 | $101,200 |
| 2015 | $4,168 | $169,900 | $68,700 | $101,200 |
| 2014 | $4,086 | $169,900 | $68,700 | $101,200 |
Source: Public Records
Map
Nearby Homes
- 2 Lyons St
- 65 Allds St
- 24 E Otterson St
- 18 Harbor Ave Unit 208
- 13 Mulvanity St
- 1 Circle Ave
- 5 Mulberry St
- 15 Lovell St Unit 3
- 15 Lovell St Unit 7
- 15 Lovell St Unit 10
- 27 Fifield St Unit 13
- 8 Buck St Unit 10
- 76 Gillis St
- 4 Chase St
- 22 Wilder St
- 38 Central St
- 30 Ledge St
- 4 Badger St
- 63 Dexter St
- 6 Hayden St
- 77 Marshall St
- 74 Marshall St Unit 57
- 4 Lyons St
- 79 Marshall St
- 3 Lyons St
- 81 Marshall St
- 73 Marshall St
- 73 1/2 Marshall St Unit 84
- 4 Dolan St
- 3 Dolan St
- 74-76 Harbor Ave
- 70 Marshall St
- 78 Harbor Ave Unit 80
- 83 Marshall St
- 74 Harbor Ave Unit 76
- 6 Dolan St
- 71 Marshall St
- 80A Harbor Ave
- 1 Lyons St
- 68 Marshall St