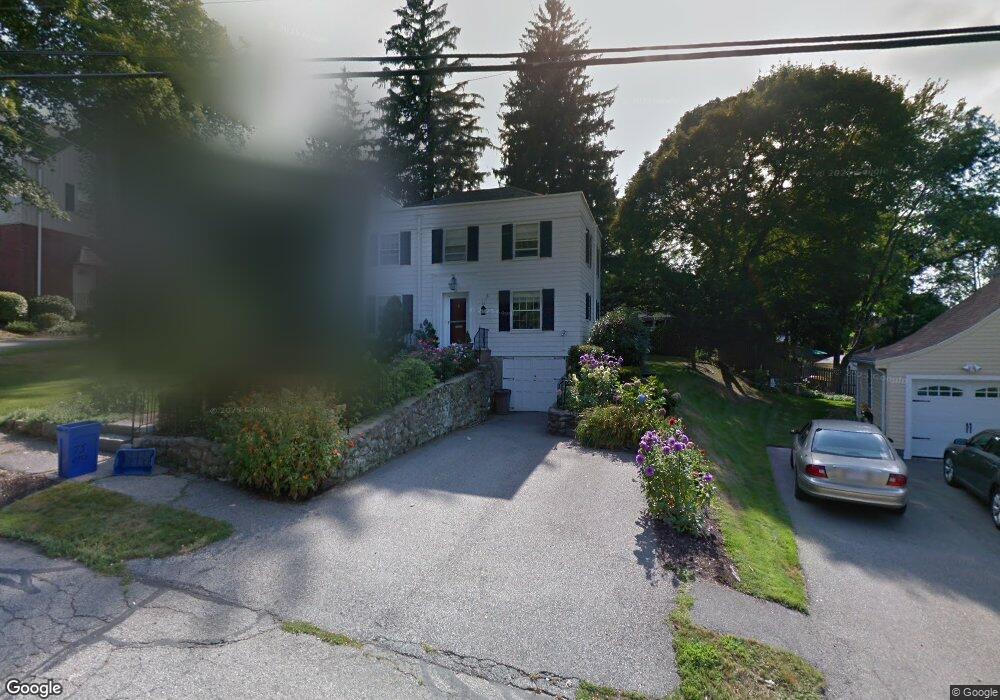
75 Otis St Milton, MA 02186
Milton Hill NeighborhoodEstimated Value: $1,068,000 - $1,228,000
3
Beds
2
Baths
1,800
Sq Ft
$644/Sq Ft
Est. Value
About This Home
This home is located at 75 Otis St, Milton, MA 02186 and is currently estimated at $1,159,151, approximately $643 per square foot. 75 Otis St is a home located in Norfolk County with nearby schools including Milton High School, St. Agatha School, and Milton Academy.
Ownership History
Date
Name
Owned For
Owner Type
Purchase Details
Closed on
Sep 1, 2000
Sold by
Miller Diane M
Bought by
Monahan John J
Current Estimated Value
Home Financials for this Owner
Home Financials are based on the most recent Mortgage that was taken out on this home.
Original Mortgage
$250,000
Interest Rate
8.16%
Mortgage Type
Purchase Money Mortgage
Purchase Details
Closed on
Aug 17, 1999
Sold by
Astrue Tr Kathleen
Bought by
Miller Diane M
Purchase Details
Closed on
Aug 24, 1990
Sold by
Hynes Paul T
Bought by
Astrue Mary P
Create a Home Valuation Report for This Property
The Home Valuation Report is an in-depth analysis detailing your home's value as well as a comparison with similar homes in the area
Home Values in the Area
Average Home Value in this Area
Purchase History
| Date | Buyer | Sale Price | Title Company |
|---|---|---|---|
| Monahan John J | $401,000 | -- | |
| Miller Diane M | $375,000 | -- | |
| Astrue Mary P | $276,500 | -- |
Source: Public Records
Mortgage History
| Date | Status | Borrower | Loan Amount |
|---|---|---|---|
| Open | Astrue Mary P | $170,000 | |
| Closed | Astrue Mary P | $150,000 | |
| Closed | Astrue Mary P | $250,000 |
Source: Public Records
Tax History
| Year | Tax Paid | Tax Assessment Tax Assessment Total Assessment is a certain percentage of the fair market value that is determined by local assessors to be the total taxable value of land and additions on the property. | Land | Improvement |
|---|---|---|---|---|
| 2025 | $11,311 | $1,019,900 | $511,300 | $508,600 |
| 2024 | $11,026 | $1,009,700 | $486,900 | $522,800 |
| 2023 | $10,773 | $945,000 | $463,800 | $481,200 |
| 2022 | $10,451 | $838,100 | $463,800 | $374,300 |
| 2021 | $10,030 | $763,900 | $407,500 | $356,400 |
| 2020 | $9,831 | $749,300 | $399,800 | $349,500 |
| 2019 | $9,587 | $727,400 | $388,100 | $339,300 |
| 2018 | $9,358 | $677,600 | $343,400 | $334,200 |
| 2017 | $8,753 | $645,500 | $327,100 | $318,400 |
| 2016 | $8,070 | $597,800 | $286,200 | $311,600 |
| 2015 | $7,787 | $558,600 | $265,700 | $292,900 |
Source: Public Records
Map
Nearby Homes
- 1185 Brook Rd
- 397 Adams St
- 400 Adams St Unit A
- 46 Century Ln
- 52 California Ave
- 440 Granite Ave Unit 201
- 0 Franklin St
- 85 Forbes Rd
- 84 Gardiner Rd
- 41 Wallace Rd
- 40 Dean Rd
- 88 Patricia Dr
- 207 Pleasant St
- 114 Willard St Unit 4
- 30 Elmwood Park
- 17 Albany St
- 281 Elmwood Ave
- 111-113 Pleasant St
- 97 Pleasant St
- 230 Willard St Unit 102
Your Personal Tour Guide
Ask me questions while you tour the home.