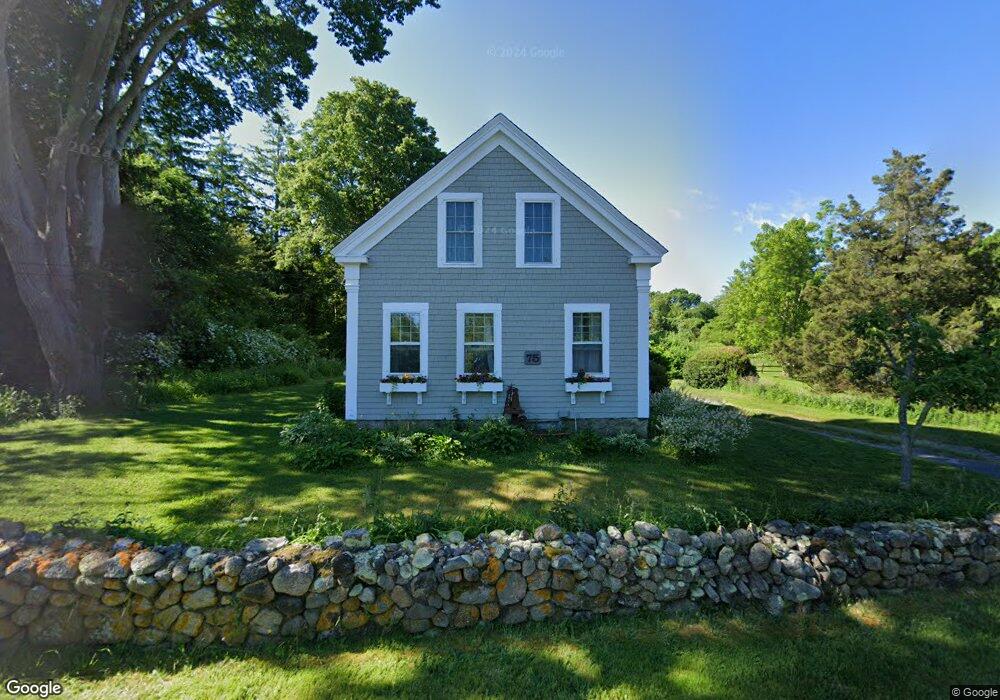
75 Parker Rd West Barnstable, MA 02668
West Barnstable NeighborhoodEstimated Value: $532,000 - $727,000
3
Beds
1
Bath
1,001
Sq Ft
$632/Sq Ft
Est. Value
About This Home
This home is located at 75 Parker Rd, West Barnstable, MA 02668 and is currently estimated at $633,073, approximately $632 per square foot. 75 Parker Rd is a home located in Barnstable County with nearby schools including West Barnstable Elementary School, Barnstable United Elementary School, and Barnstable Intermediate School.
Ownership History
Date
Name
Owned For
Owner Type
Purchase Details
Closed on
Feb 10, 2026
Sold by
Morales Harry and Morales Kerin M
Bought by
Dream On Rt and Morales
Current Estimated Value
Purchase Details
Closed on
Jun 22, 1993
Sold by
Peterson Paul
Bought by
Morales Harry and Morales Kerin M
Create a Home Valuation Report for This Property
The Home Valuation Report is an in-depth analysis detailing your home's value as well as a comparison with similar homes in the area
Home Values in the Area
Average Home Value in this Area
Purchase History
| Date | Buyer | Sale Price | Title Company |
|---|---|---|---|
| Dream On Rt | -- | -- | |
| Morales Harry | $90,000 | -- |
Source: Public Records
Mortgage History
| Date | Status | Borrower | Loan Amount |
|---|---|---|---|
| Previous Owner | Morales Harry | $195,000 | |
| Previous Owner | Morales Harry | $185,000 | |
| Previous Owner | Morales Harry | $164,000 | |
| Previous Owner | Morales Harry | $100,000 |
Source: Public Records
Tax History
| Year | Tax Paid | Tax Assessment Tax Assessment Total Assessment is a certain percentage of the fair market value that is determined by local assessors to be the total taxable value of land and additions on the property. | Land | Improvement |
|---|---|---|---|---|
| 2025 | $5,537 | $592,800 | $299,800 | $293,000 |
| 2024 | $5,102 | $594,600 | $299,800 | $294,800 |
| 2023 | $5,017 | $550,700 | $296,600 | $254,100 |
| 2022 | $4,492 | $404,300 | $190,000 | $214,300 |
| 2021 | $1,796 | $383,800 | $201,900 | $181,900 |
| 2020 | $4,586 | $378,400 | $213,800 | $164,600 |
| 2019 | $4,606 | $375,100 | $225,600 | $149,500 |
| 2018 | $4,322 | $348,800 | $225,000 | $123,800 |
| 2017 | $1,572 | $354,200 | $231,300 | $122,900 |
| 2016 | $4,247 | $354,200 | $231,300 | $122,900 |
| 2015 | $4,391 | $367,100 | $229,400 | $137,700 |
Source: Public Records
Map
Nearby Homes
Your Personal Tour Guide
Ask me questions while you tour the home.