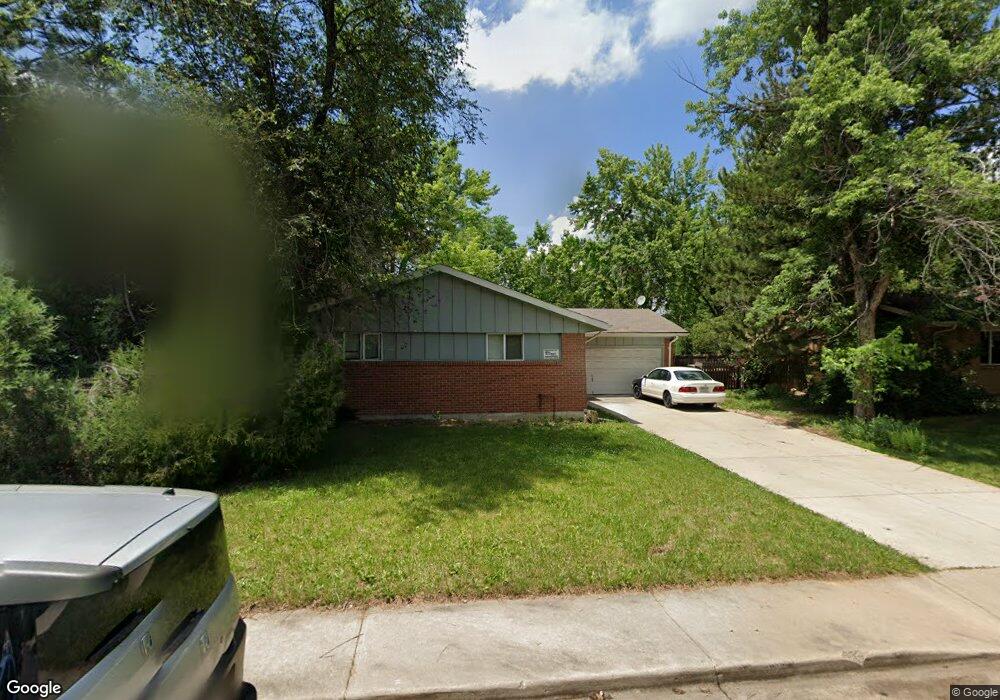
75 S 35th St Boulder, CO 80305
South Boulder NeighborhoodEstimated Value: $838,000 - $908,000
3
Beds
2
Baths
1,204
Sq Ft
$723/Sq Ft
Est. Value
About This Home
This home is located at 75 S 35th St, Boulder, CO 80305 and is currently estimated at $870,703, approximately $723 per square foot. 75 S 35th St is a home located in Boulder County with nearby schools including Creekside Elementary School, Manhattan Middle School of the Arts & Academics, and Fairview High School.
Ownership History
Date
Name
Owned For
Owner Type
Purchase Details
Closed on
Dec 7, 2012
Sold by
35Th & 30Th Llc
Bought by
75 South 35Th Street Lllp
Current Estimated Value
Purchase Details
Closed on
Jan 24, 2007
Sold by
Bruggeman Jack A
Bought by
35Th & 30Th Llc
Purchase Details
Closed on
May 7, 1980
Bought by
75 South 35Th Street Lllp
Purchase Details
Closed on
Oct 4, 1979
Bought by
75 South 35Th Street Lllp
Create a Home Valuation Report for This Property
The Home Valuation Report is an in-depth analysis detailing your home's value as well as a comparison with similar homes in the area
Home Values in the Area
Average Home Value in this Area
Purchase History
| Date | Buyer | Sale Price | Title Company |
|---|---|---|---|
| 75 South 35Th Street Lllp | -- | None Available | |
| 35Th & 30Th Llc | -- | None Available | |
| 75 South 35Th Street Lllp | $79,000 | -- | |
| 75 South 35Th Street Lllp | $66,000 | -- |
Source: Public Records
Tax History
| Year | Tax Paid | Tax Assessment Tax Assessment Total Assessment is a certain percentage of the fair market value that is determined by local assessors to be the total taxable value of land and additions on the property. | Land | Improvement |
|---|---|---|---|---|
| 2025 | $5,048 | $52,769 | $38,644 | $14,125 |
| 2024 | $5,048 | $52,769 | $38,644 | $14,125 |
| 2023 | $4,958 | $56,541 | $45,285 | $14,941 |
| 2022 | $4,432 | $46,919 | $33,589 | $13,330 |
| 2021 | $4,230 | $48,270 | $34,556 | $13,714 |
| 2020 | $4,060 | $46,647 | $28,171 | $18,476 |
| 2019 | $3,998 | $46,647 | $28,171 | $18,476 |
| 2018 | $3,433 | $39,600 | $25,920 | $13,680 |
| 2017 | $3,326 | $47,720 | $28,656 | $19,064 |
| 2016 | $3,170 | $36,616 | $20,696 | $15,920 |
| 2015 | $3,001 | $31,530 | $16,159 | $15,371 |
| 2014 | $2,651 | $31,530 | $16,159 | $15,371 |
Source: Public Records
Map
Nearby Homes
- 3505 Moorhead Ave
- 355 32nd St
- 80 S Lashley Ln
- 3200 Eastman Ave
- 265 S 39th St
- 3000 Dartmouth Ave
- 345 S 38th St
- 735 32nd St
- 135 S 42nd St
- 375 S 40th St
- 2640 Kohler Dr
- 780 33rd St
- 2955 Stanford Ave
- 4195 Chippewa Dr
- 3100 Arrowwood Ln
- 405 S 43rd St
- 770 36th St
- 805 29th St Unit 157
- 805 29th St Unit 152
- 805 29th St Unit 362
Your Personal Tour Guide
Ask me questions while you tour the home.