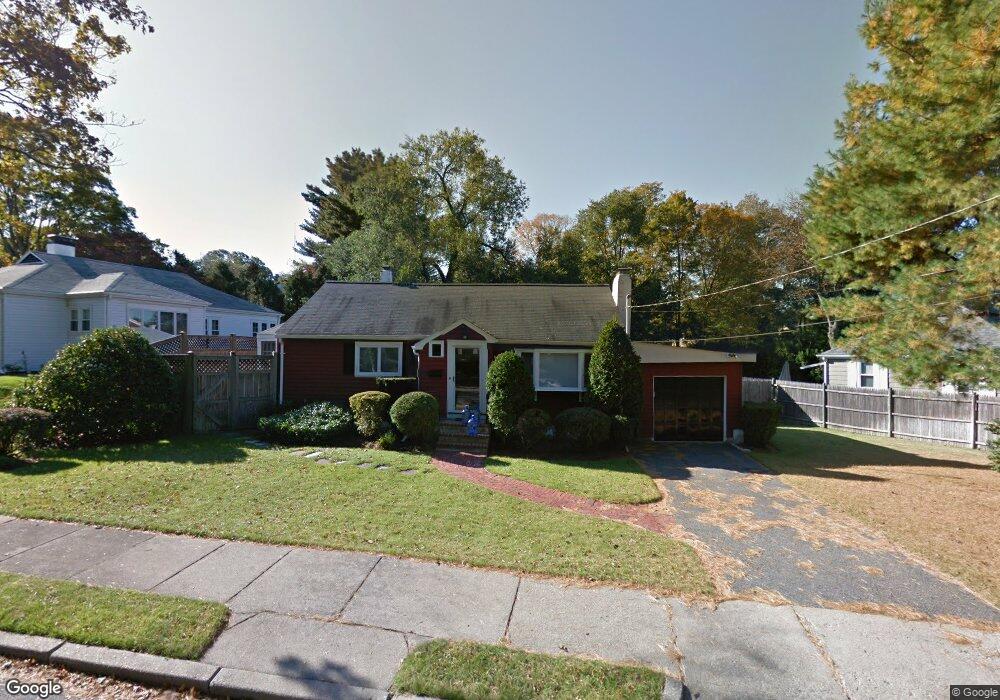
75 Stanley Rd Waban, MA 02468
Waban NeighborhoodEstimated Value: $1,001,000 - $1,416,000
2
Beds
1
Bath
1,024
Sq Ft
$1,147/Sq Ft
Est. Value
About This Home
This home is located at 75 Stanley Rd, Waban, MA 02468 and is currently estimated at $1,174,736, approximately $1,147 per square foot. 75 Stanley Rd is a home located in Middlesex County with nearby schools including Angier Elementary School, Charles E Brown Middle School, and Newton South High School.
Ownership History
Date
Name
Owned For
Owner Type
Purchase Details
Closed on
May 1, 2006
Sold by
Miller Beth A
Bought by
Miller Bradley S
Current Estimated Value
Purchase Details
Closed on
Aug 2, 1993
Sold by
Card Michael B and Marcoux Sandra
Bought by
Miller Beth A
Home Financials for this Owner
Home Financials are based on the most recent Mortgage that was taken out on this home.
Original Mortgage
$100,000
Interest Rate
7.32%
Mortgage Type
Purchase Money Mortgage
Purchase Details
Closed on
Dec 14, 1992
Sold by
75 Stanley Rd Nt
Bought by
Card Michael B and Marcoux Sandra
Home Financials for this Owner
Home Financials are based on the most recent Mortgage that was taken out on this home.
Original Mortgage
$125,000
Interest Rate
8.16%
Mortgage Type
Purchase Money Mortgage
Create a Home Valuation Report for This Property
The Home Valuation Report is an in-depth analysis detailing your home's value as well as a comparison with similar homes in the area
Home Values in the Area
Average Home Value in this Area
Purchase History
| Date | Buyer | Sale Price | Title Company |
|---|---|---|---|
| Miller Bradley S | $555,000 | -- | |
| Miller Beth A | $187,000 | -- | |
| Miller Beth A | $187,000 | -- | |
| Card Michael B | $182,000 | -- | |
| Card Michael B | $182,000 | -- |
Source: Public Records
Mortgage History
| Date | Status | Borrower | Loan Amount |
|---|---|---|---|
| Previous Owner | Card Michael B | $100,000 | |
| Previous Owner | Card Michael B | $125,000 |
Source: Public Records
Tax History
| Year | Tax Paid | Tax Assessment Tax Assessment Total Assessment is a certain percentage of the fair market value that is determined by local assessors to be the total taxable value of land and additions on the property. | Land | Improvement |
|---|---|---|---|---|
| 2025 | $8,320 | $849,000 | $0 | $0 |
| 2024 | $8,045 | $0 | $0 | $0 |
| 2023 | $7,620 | $748,500 | $0 | $0 |
| 2022 | $7,291 | $693,100 | $693,100 | $0 |
| 2021 | $7,036 | $653,900 | $653,900 | $0 |
| 2020 | $6,827 | $653,900 | $653,900 | $0 |
| 2019 | $6,635 | $634,900 | $0 | $0 |
| 2018 | $6,347 | $586,600 | $0 | $0 |
| 2017 | $6,154 | $553,400 | $0 | $0 |
| 2016 | $5,886 | $517,200 | $0 | $0 |
| 2015 | $5,612 | $483,400 | $483,400 | $0 |
Source: Public Records
Map
Nearby Homes
- 873 Chestnut St
- 34 Larchmont Ave
- 1003 Chestnut St
- 59 Roundwood Rd
- 1077 Boylston St Unit 1
- 126 Beethoven Ave
- 110 Avalon Rd
- 18 Josselyn Place Unit 18
- 16-18 Josselyn Place Unit 16
- 304 Elliot St Carriage House S Unit 4
- 302 Elliot St Carriage House N Unit 3
- 27 Hamilton Place
- 300 Elliot St Unit 2
- 20 Kinmonth Rd Unit 203
- 20 Kinmonth Rd Unit 306
- 20 Kinmonth Rd Unit 4
- 187 Saint Mary St
- 1438 Beacon St
- 181 Saint Mary St
- 91 Waban Ave
Your Personal Tour Guide
Ask me questions while you tour the home.