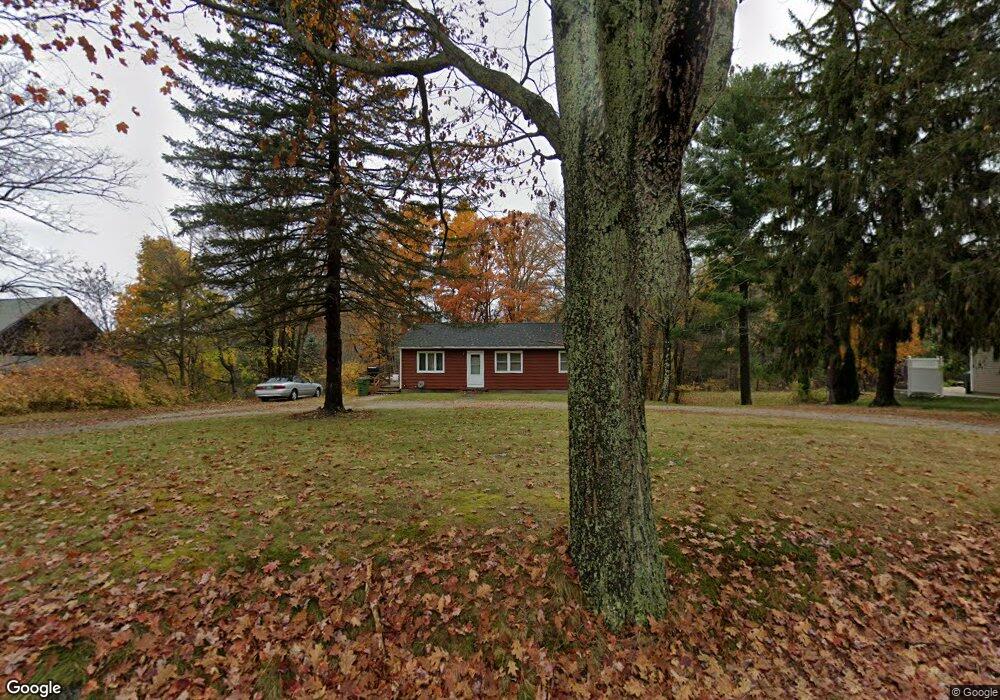
750 Fowler Rd Northbridge, MA 01534
Estimated Value: $404,000 - $465,000
3
Beds
3
Baths
1,008
Sq Ft
$427/Sq Ft
Est. Value
About This Home
This home is located at 750 Fowler Rd, Northbridge, MA 01534 and is currently estimated at $430,444, approximately $427 per square foot. 750 Fowler Rd is a home located in Worcester County with nearby schools including Northbridge Elementary School, Northbridge Middle School, and Northbridge High School.
Ownership History
Date
Name
Owned For
Owner Type
Purchase Details
Closed on
Sep 9, 2015
Sold by
Michelson Jon D
Bought by
Michelson Ryan A
Current Estimated Value
Home Financials for this Owner
Home Financials are based on the most recent Mortgage that was taken out on this home.
Original Mortgage
$180,500
Outstanding Balance
$141,866
Interest Rate
4.01%
Mortgage Type
New Conventional
Estimated Equity
$288,578
Purchase Details
Closed on
Jun 23, 2010
Sold by
Michelson Jon D and Michelson Susan M
Bought by
Michelson Jon D
Home Financials for this Owner
Home Financials are based on the most recent Mortgage that was taken out on this home.
Original Mortgage
$145,000
Interest Rate
4.98%
Mortgage Type
Purchase Money Mortgage
Purchase Details
Closed on
Mar 26, 1999
Sold by
Gauthier Rachel M
Bought by
Michelson Jon D and Michelson Susan M
Create a Home Valuation Report for This Property
The Home Valuation Report is an in-depth analysis detailing your home's value as well as a comparison with similar homes in the area
Home Values in the Area
Average Home Value in this Area
Purchase History
| Date | Buyer | Sale Price | Title Company |
|---|---|---|---|
| Michelson Ryan A | $190,000 | -- | |
| Michelson Ryan A | $190,000 | -- | |
| Michelson Ryan A | $190,000 | -- | |
| Michelson Jon D | -- | -- | |
| Michelson Jon D | -- | -- | |
| Michelson Jon D | -- | -- | |
| Michelson Jon D | $112,000 | -- | |
| Michelson Jon D | $112,000 | -- |
Source: Public Records
Mortgage History
| Date | Status | Borrower | Loan Amount |
|---|---|---|---|
| Open | Michelson Ryan A | $180,500 | |
| Closed | Michelson Ryan A | $180,500 | |
| Previous Owner | Michelson Jon D | $145,000 |
Source: Public Records
Tax History Compared to Growth
Tax History
| Year | Tax Paid | Tax Assessment Tax Assessment Total Assessment is a certain percentage of the fair market value that is determined by local assessors to be the total taxable value of land and additions on the property. | Land | Improvement |
|---|---|---|---|---|
| 2025 | $4,079 | $346,000 | $151,300 | $194,700 |
| 2024 | $3,972 | $328,500 | $151,300 | $177,200 |
| 2023 | $4,172 | $321,900 | $151,300 | $170,600 |
| 2022 | $3,696 | $268,400 | $116,400 | $152,000 |
| 2021 | $3,501 | $241,600 | $110,800 | $130,800 |
| 2020 | $3,270 | $236,300 | $110,800 | $125,500 |
| 2019 | $4,370 | $229,700 | $110,800 | $118,900 |
| 2018 | $22 | $219,000 | $105,400 | $113,600 |
| 2017 | $2,856 | $211,100 | $105,400 | $105,700 |
| 2016 | $2,694 | $195,900 | $95,800 | $100,100 |
| 2015 | $2,621 | $195,900 | $95,800 | $100,100 |
| 2014 | $2,485 | $187,400 | $95,800 | $91,600 |
Source: Public Records
Map
Nearby Homes
- 135 Windstone Dr
- 731 Samuel Dr
- 331 Cooper Rd
- 86 Kingsnorth St
- 104 Alana Dr
- 192 Rebecca Rd
- 151 Fowler Rd
- 46 Rebecca Rd
- 614-616 Sutton St
- 708 Marston Rd
- 894 Marston Rd
- 157 Rolling Ridge Dr Unit 84
- 1880 Providence Rd
- 90 Nathaniel Dr
- 102 Kennedy Cir
- 0 Puddon St
- 79-81 Upton St
- 7 Central Turnpike
- 19 & 20 Wunschel Dr
- 2767 Providence Rd