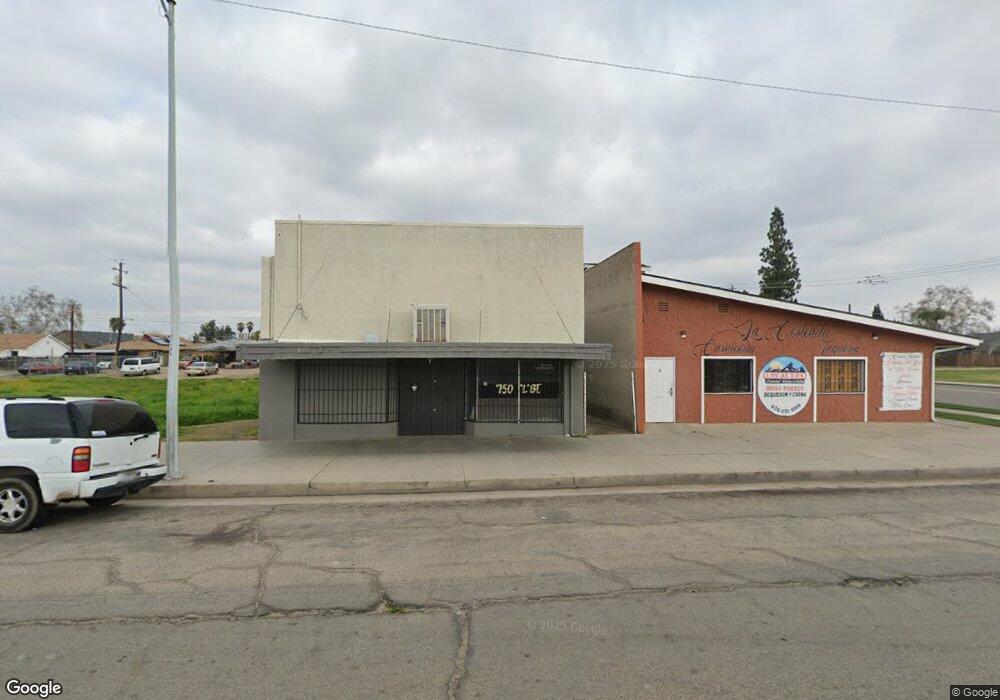
750 L St Sanger, CA 93657
Estimated Value: $338,219
Studio
--
Bath
2,804
Sq Ft
$121/Sq Ft
Est. Value
About This Home
This home is located at 750 L St, Sanger, CA 93657 and is currently estimated at $338,219, approximately $120 per square foot. 750 L St is a home located in Fresno County with nearby schools including Wilson Elementary School, Washington Academic Middle School, and Sanger High School.
Ownership History
Date
Name
Owned For
Owner Type
Purchase Details
Closed on
May 13, 2021
Sold by
Gonzalez Angela and The Angela Gonzalez Living Tru
Bought by
Romero Salvador and Calderon Ana Lilia
Current Estimated Value
Home Financials for this Owner
Home Financials are based on the most recent Mortgage that was taken out on this home.
Original Mortgage
$100,000
Outstanding Balance
$90,483
Interest Rate
3%
Mortgage Type
Commercial
Estimated Equity
$247,736
Purchase Details
Closed on
Feb 6, 2021
Sold by
Benitez Angel and Benitez Luz
Bought by
Gonzalez Angela and The Angela Gonzalez Living Tru
Purchase Details
Closed on
Mar 29, 2005
Sold by
Benitez Angel and Benitez Luz
Bought by
Benitez Angel and Benitez Luz
Purchase Details
Closed on
Sep 7, 2004
Sold by
Gonzalez Juan E and Gonzalez Angela R
Bought by
Gonzalez Juan E and Gonzalez Angela
Purchase Details
Closed on
Feb 5, 1999
Sold by
Louise Lombardi Ann and Jennie Moore
Bought by
Gonzalez Juan E and Gonzales Angela R
Create a Home Valuation Report for This Property
The Home Valuation Report is an in-depth analysis detailing your home's value as well as a comparison with similar homes in the area
Home Values in the Area
Average Home Value in this Area
Purchase History
| Date | Buyer | Sale Price | Title Company |
|---|---|---|---|
| Romero Salvador | $270,000 | Old Republic Title Company | |
| Gonzalez Angela | -- | Accommodation | |
| Benitez Angel | -- | -- | |
| Benitez Angel | -- | -- | |
| Gonzalez Angela | -- | -- | |
| Gonzalez Juan E | -- | -- | |
| Gonzalez Juan E | $65,000 | Chicago Title Co |
Source: Public Records
Mortgage History
| Date | Status | Borrower | Loan Amount |
|---|---|---|---|
| Open | Romero Salvador | $100,000 |
Source: Public Records
Tax History
| Year | Tax Paid | Tax Assessment Tax Assessment Total Assessment is a certain percentage of the fair market value that is determined by local assessors to be the total taxable value of land and additions on the property. | Land | Improvement |
|---|---|---|---|---|
| 2025 | $3,706 | $292,254 | $27,060 | $265,194 |
| 2023 | $3,469 | $280,908 | $26,010 | $254,898 |
| 2022 | $3,417 | $275,400 | $25,500 | $249,900 |
| 2021 | $1,200 | $94,115 | $26,058 | $68,057 |
| 2020 | $1,166 | $93,151 | $25,791 | $67,360 |
| 2019 | $1,143 | $91,326 | $25,286 | $66,040 |
| 2018 | $1,177 | $96,357 | $24,791 | $71,566 |
| 2017 | $1,159 | $94,602 | $24,305 | $70,297 |
| 2016 | $1,091 | $92,882 | $23,829 | $69,053 |
| 2015 | $1,094 | $90,971 | $23,472 | $67,499 |
| 2014 | $1,090 | $90,012 | $23,013 | $66,999 |
Source: Public Records
Map
Nearby Homes
Your Personal Tour Guide
Ask me questions while you tour the home.