7505 Mark St Loretto, MN 55357
Estimated Value: $764,000 - $897,000
4
Beds
3
Baths
3,702
Sq Ft
$225/Sq Ft
Est. Value
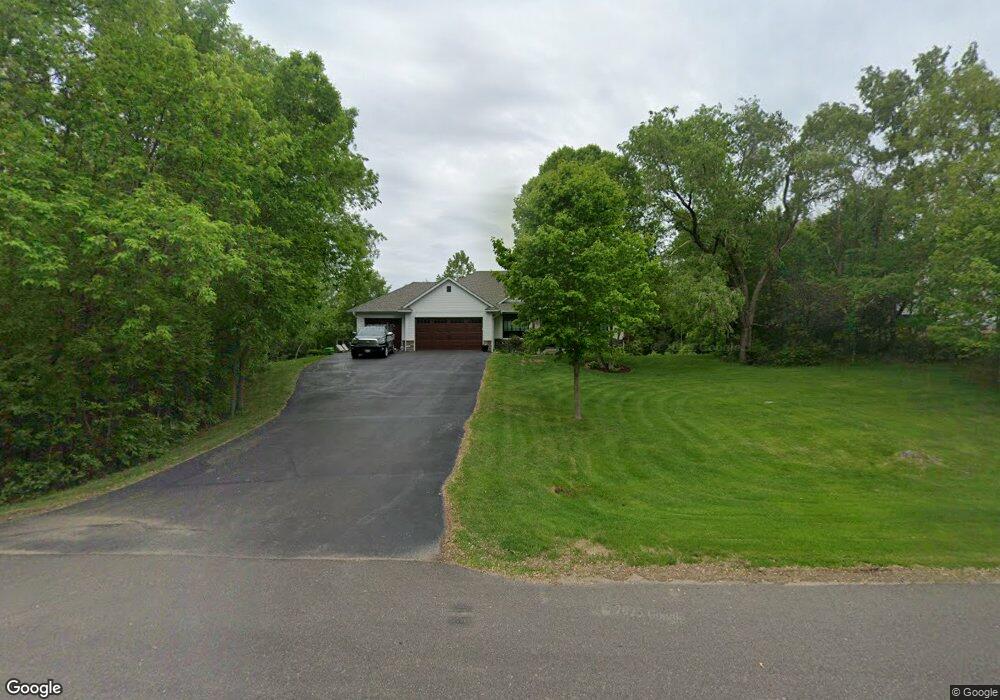
About This Home
This home is located at 7505 Mark St, Loretto, MN 55357 and is currently estimated at $832,876, approximately $224 per square foot. 7505 Mark St is a home located in Hennepin County with nearby schools including Rockford Elementary Arts Magnet School, Rockford Middle School - Center for Environmental Studies, and Rockford High School.
Ownership History
Date
Name
Owned For
Owner Type
Purchase Details
Closed on
Aug 29, 2022
Sold by
Nolby Brent and Nolby Kristen
Bought by
Tate Eric and Tate Kelly
Current Estimated Value
Home Financials for this Owner
Home Financials are based on the most recent Mortgage that was taken out on this home.
Original Mortgage
$650,250
Outstanding Balance
$622,510
Interest Rate
5.51%
Mortgage Type
New Conventional
Estimated Equity
$210,366
Purchase Details
Closed on
Aug 25, 2022
Sold by
Nolby Brent C and Nolby Kristen L
Bought by
Tate Eric G and Tate Kelly L
Home Financials for this Owner
Home Financials are based on the most recent Mortgage that was taken out on this home.
Original Mortgage
$650,250
Outstanding Balance
$622,510
Interest Rate
5.51%
Mortgage Type
New Conventional
Estimated Equity
$210,366
Purchase Details
Closed on
Jul 15, 2002
Sold by
Weber Barbara J
Bought by
Nolby Brent C and Nolby Kristen L
Create a Home Valuation Report for This Property
The Home Valuation Report is an in-depth analysis detailing your home's value as well as a comparison with similar homes in the area
Home Values in the Area
Average Home Value in this Area
Purchase History
| Date | Buyer | Sale Price | Title Company |
|---|---|---|---|
| Tate Eric | $765,000 | -- | |
| Tate Eric G | $765,000 | Title Choice | |
| Nolby Brent C | $91,000 | -- |
Source: Public Records
Mortgage History
| Date | Status | Borrower | Loan Amount |
|---|---|---|---|
| Open | Tate Eric | $650,250 | |
| Closed | Tate Eric G | $650,250 |
Source: Public Records
Tax History
| Year | Tax Paid | Tax Assessment Tax Assessment Total Assessment is a certain percentage of the fair market value that is determined by local assessors to be the total taxable value of land and additions on the property. | Land | Improvement |
|---|---|---|---|---|
| 2024 | $9,835 | $706,800 | $205,000 | $501,800 |
| 2023 | $10,318 | $729,600 | $215,000 | $514,600 |
| 2022 | $7,535 | $610,000 | $155,000 | $455,000 |
| 2021 | $7,524 | $549,000 | $155,000 | $394,000 |
| 2020 | $7,388 | $538,000 | $160,000 | $378,000 |
| 2019 | $7,054 | $502,000 | $130,000 | $372,000 |
| 2018 | $6,460 | $471,000 | $110,000 | $361,000 |
| 2017 | $6,129 | $423,000 | $118,000 | $305,000 |
| 2016 | $5,149 | $350,000 | $106,000 | $244,000 |
| 2015 | $5,254 | $349,000 | $106,000 | $243,000 |
| 2014 | -- | $319,000 | $83,000 | $236,000 |
Source: Public Records
Map
Nearby Homes
- 6460 Elmwood Dr
- 6900 Nyle Ct
- 8634 Whisper Creek Trail
- TBD Nyle Ct
- 5955 84th Ln N
- 7801 Bridgewater Ct
- 7806 Bridgewater Ct
- 7803 Bridgewater Ct
- 7804 Bridgewater Ct
- 7865 Kettering Creek Ct
- 6235 N Shore Dr
- TBD 69th Ln N
- 7872 Willowbrook Ct
- 7870 Willowbrook Ct
- TBD Jansen Ave SE
- 4090 Maple Hurst Dr S
- 5230 Rebecca Park Trail
- 4040 Maple Hurst Dr S
- 5470 Town Hall Dr
- 7050 Pioneer Trail
Your Personal Tour Guide
Ask me questions while you tour the home.