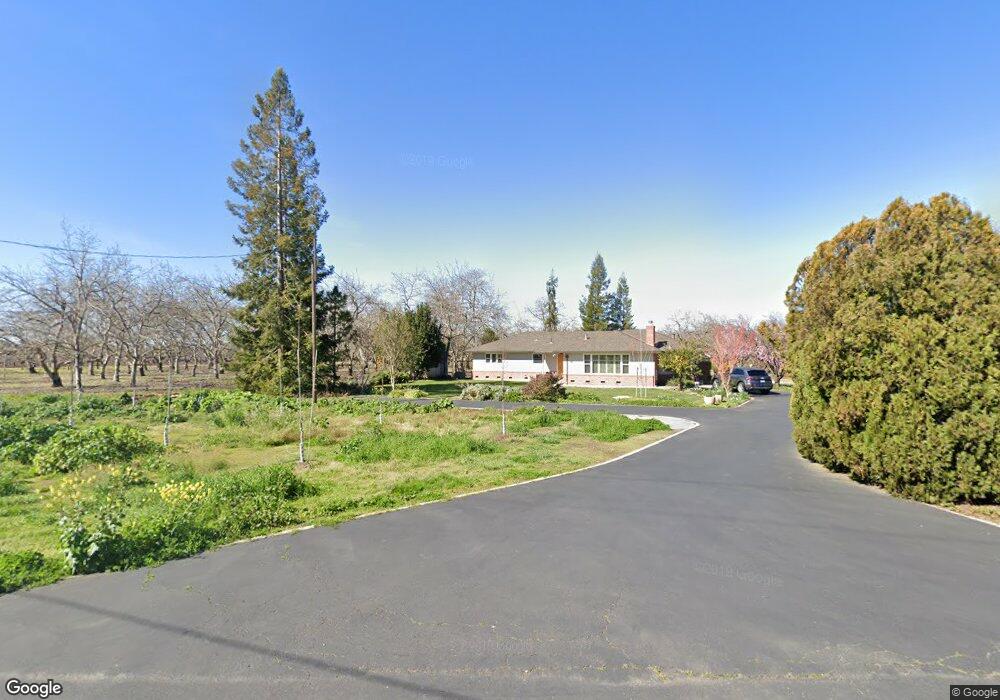
7505 N Alpine Rd Stockton, CA 95215
Estimated Value: $699,875 - $799,000
3
Beds
3
Baths
2,171
Sq Ft
$340/Sq Ft
Est. Value
About This Home
This home is located at 7505 N Alpine Rd, Stockton, CA 95215 and is currently estimated at $737,219, approximately $339 per square foot. 7505 N Alpine Rd is a home located in San Joaquin County with nearby schools including Waverly Elementary School, Linden High School, and Stockton Baptist School.
Ownership History
Date
Name
Owned For
Owner Type
Purchase Details
Closed on
Jan 12, 2023
Sold by
Russell S Aoyama Family Trust and Aoyama Russell S
Bought by
Russell S Aoyama Family Trust and Aoyama
Current Estimated Value
Purchase Details
Closed on
Oct 11, 2008
Sold by
Aoyama Russell S and Aoyama Brenda Carol
Bought by
Aoyama Russell S
Purchase Details
Closed on
Dec 21, 2006
Sold by
Aoyama Russell S and Aoyama Brenda
Bought by
Aoyama Russell S and Aoyama Brenda Carol
Purchase Details
Closed on
Jan 4, 1994
Sold by
Aoyama Russell S and Aoyama Brenda C
Bought by
Aoyama Russell S and Aoyama Brenda
Home Financials for this Owner
Home Financials are based on the most recent Mortgage that was taken out on this home.
Original Mortgage
$201,000
Interest Rate
7.29%
Create a Home Valuation Report for This Property
The Home Valuation Report is an in-depth analysis detailing your home's value as well as a comparison with similar homes in the area
Home Values in the Area
Average Home Value in this Area
Purchase History
| Date | Buyer | Sale Price | Title Company |
|---|---|---|---|
| Russell S Aoyama Family Trust | -- | Chicago Title | |
| Aoyama Russell S | -- | None Available | |
| Aoyama Russell S | -- | None Available | |
| Aoyama Russell S | -- | Alliance Title Company |
Source: Public Records
Mortgage History
| Date | Status | Borrower | Loan Amount |
|---|---|---|---|
| Previous Owner | Aoyama Russell S | $201,000 |
Source: Public Records
Tax History Compared to Growth
Tax History
| Year | Tax Paid | Tax Assessment Tax Assessment Total Assessment is a certain percentage of the fair market value that is determined by local assessors to be the total taxable value of land and additions on the property. | Land | Improvement |
|---|---|---|---|---|
| 2025 | $4,731 | $368,800 | $14,713 | $354,087 |
| 2024 | $4,708 | $376,691 | $14,425 | $362,266 |
| 2023 | $7,311 | $630,171 | $159,271 | $389,150 |
| 2022 | $7,301 | $621,335 | $156,149 | $465,186 |
| 2021 | $7,530 | $615,214 | $153,088 | $462,126 |
| 2020 | $7,348 | $615,431 | $151,519 | $463,912 |
| 2019 | $7,210 | $600,533 | $148,549 | $451,984 |
| 2018 | $6,583 | $594,374 | $145,637 | $448,737 |
| 2017 | $6,137 | $556,509 | $142,782 | $413,727 |
| 2016 | $6,115 | $552,069 | $139,983 | $412,086 |
| 2014 | $6,158 | $550,865 | $135,180 | $415,685 |
Source: Public Records
Map
Nearby Homes
- 5460 Hildreth Ln
- 5242 E Hildreth Ln
- 5233 Hildreth Ln
- 9432 Plum Ave
- 5835 Cherokee Rd Unit 61
- 5835 Cherokee Rd Unit 41
- 5835 Cherokee Rd Unit 7
- 5115 Hildreth Ln
- 5119 Foppiano Ln
- 4944 Manor Cir
- 9666 Leland Way
- 4817 E Morada Ln
- 9748 Cole Dr
- 9109 Valley Dr
- 5425 El Greco Dr
- 9704 Springfield Way
- 10374 Black Oak Ct
- 4520 E Morada Ln
- 9937 Laron Ct
- 9454 N Highway 99 Unit 9
- 7615 N Alpine Rd
- 7641 N Alpine Rd
- 7549 N Alpine Rd
- 7622 N Alpine Rd
- 7755 N Alpine Rd
- 5874 N Alpine Rd
- 8233 N Alpine Rd
- 7953 E Cherokee Rd
- 7766 N Alpine Rd
- 5850 N Alpine Rd
- 8255 N Alpine Rd
- 5800 N Alpine Rd
- 7463 E Cherokee Rd
- 7437 E Cherokee Rd
- 7437 E Cherokee Rd
- 7610 N Alpine Rd
- 8014 N Alpine Rd
- 7475 E Cherokee Rd
- 5766 N Alpine Rd
- 7510 Foppiano Ln