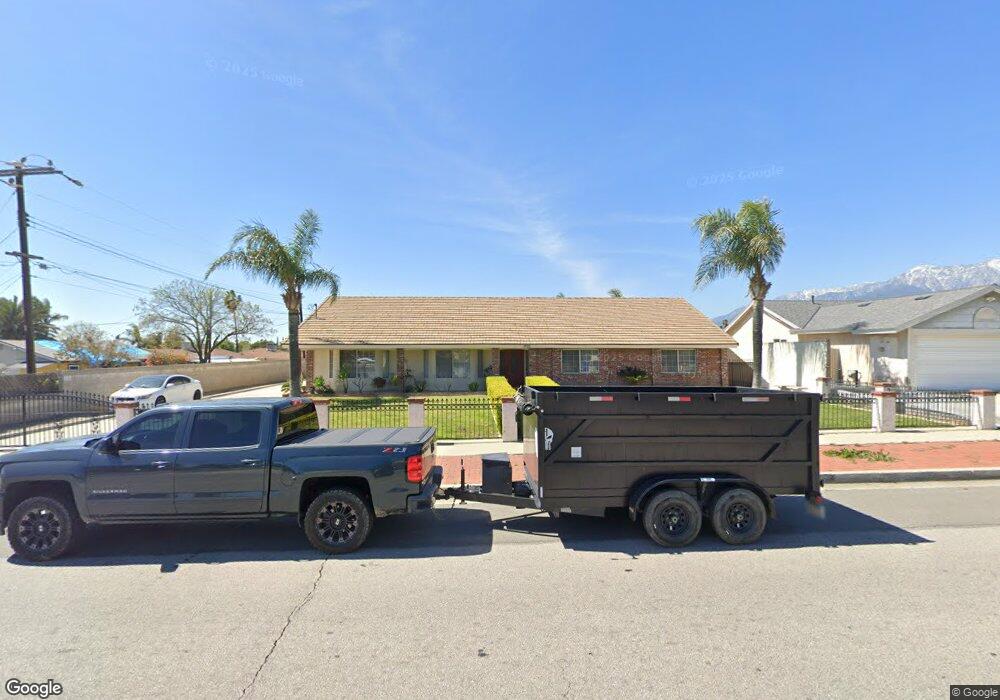
7508 Cypress Ave Fontana, CA 92336
Estimated Value: $723,000 - $832,000
3
Beds
3
Baths
2,640
Sq Ft
$296/Sq Ft
Est. Value
About This Home
This home is located at 7508 Cypress Ave, Fontana, CA 92336 and is currently estimated at $780,178, approximately $295 per square foot. 7508 Cypress Ave is a home located in San Bernardino County with nearby schools including Kathy Binks Elementary School, Wayne Ruble Middle School, and Fontana A. B. Miller High School.
Ownership History
Date
Name
Owned For
Owner Type
Purchase Details
Closed on
Oct 8, 2020
Sold by
Renova Jesse Ruben and Renova Candy Jean
Bought by
Renova Jesse Ruben and Renova Candy Jean
Current Estimated Value
Home Financials for this Owner
Home Financials are based on the most recent Mortgage that was taken out on this home.
Original Mortgage
$436,000
Interest Rate
2.9%
Mortgage Type
New Conventional
Purchase Details
Closed on
Jul 28, 2015
Sold by
Renova Jesse Ruben and Renova Candy Jean
Bought by
Jesse & Candy Renova Living Trust
Purchase Details
Closed on
Apr 17, 1995
Sold by
Renova Jesse Ruben and Renova Candy Jean
Bought by
Renova Jesse Ruben and Renova Candy Jean
Home Financials for this Owner
Home Financials are based on the most recent Mortgage that was taken out on this home.
Original Mortgage
$140,000
Interest Rate
8.62%
Create a Home Valuation Report for This Property
The Home Valuation Report is an in-depth analysis detailing your home's value as well as a comparison with similar homes in the area
Home Values in the Area
Average Home Value in this Area
Purchase History
| Date | Buyer | Sale Price | Title Company |
|---|---|---|---|
| Renova Jesse Ruben | -- | Wfg National Title | |
| Renova Jesse R | -- | Wfg National Title | |
| Jesse & Candy Renova Living Trust | -- | None Available | |
| Renova Jesse Ruben | -- | Stewart Title Company |
Source: Public Records
Mortgage History
| Date | Status | Borrower | Loan Amount |
|---|---|---|---|
| Closed | Renova Jesse R | $436,000 | |
| Closed | Renova Jesse Ruben | $140,000 |
Source: Public Records
Tax History Compared to Growth
Tax History
| Year | Tax Paid | Tax Assessment Tax Assessment Total Assessment is a certain percentage of the fair market value that is determined by local assessors to be the total taxable value of land and additions on the property. | Land | Improvement |
|---|---|---|---|---|
| 2025 | $3,416 | $293,956 | $68,160 | $225,796 |
| 2024 | $3,416 | $288,193 | $66,824 | $221,369 |
| 2023 | $2,903 | $282,542 | $65,514 | $217,028 |
| 2022 | $2,890 | $277,002 | $64,229 | $212,773 |
| 2021 | $2,853 | $271,571 | $62,970 | $208,601 |
| 2020 | $2,921 | $268,786 | $62,324 | $206,462 |
| 2019 | $2,832 | $263,516 | $61,102 | $202,414 |
| 2018 | $2,875 | $258,349 | $59,904 | $198,445 |
| 2017 | $2,859 | $253,283 | $58,729 | $194,554 |
| 2016 | $2,811 | $248,316 | $57,577 | $190,739 |
| 2015 | $2,775 | $244,586 | $56,712 | $187,874 |
| 2014 | $2,778 | $239,795 | $55,601 | $184,194 |
Source: Public Records
Map
Nearby Homes
- 7625 Cypress Ave
- 7372 Oleander Ave
- 16733 Miller Ave
- 7801 Pinyon Ave
- 16198 Baseline Ave
- 16554 Reed St
- 16843 Miller Ave
- 7938 Chantry Ave
- 7901 Pinyon Ave
- 7155 Citrus Ave Unit 411
- 7155 Citrus Ave Unit 433
- 7055 Springtime Ave
- 16045 Jackson Dr
- 16960 Beachwood Ln
- 16010 Ramona Dr
- 16539 Pismo Way
- 16936 Baseline Ave
- 16827 Dove Tree Ln
- 7702 Newport Ct
- 7015 Sweetleaf Dr
- 7511 Cypress Ave
- 16482 Elaine Dr
- 16494 Elaine Dr
- 16481 San Jacinto Ave
- 7464 Cypress Ave
- 16472 Elaine Dr
- 16467 San Jacinto Ave
- 16462 Elaine Dr
- 7515 Cypress Ave
- 7462 Cypress Ave
- 16503 San Jacinto Ave
- 16455 San Jacinto Ave
- 7525 Cypress Ave
- 16452 Elaine Dr
- 16513 San Jacinto Ave
- 7460 Cypress Ave Unit 2
- 7460 Cypress Ave Unit 3
- 7460 Cypress Ave Unit 1
- 7460 Cypress Ave
- 7546 Cypress Ave