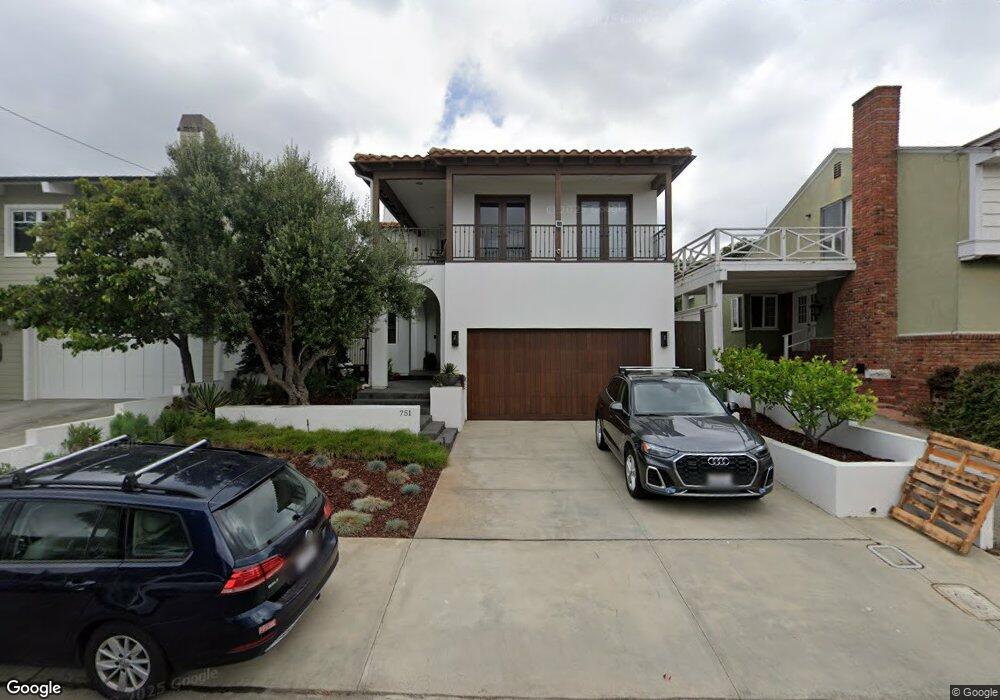
751 26th St Manhattan Beach, CA 90266
Estimated Value: $4,206,228 - $5,318,000
5
Beds
6
Baths
3,484
Sq Ft
$1,380/Sq Ft
Est. Value
About This Home
This home is located at 751 26th St, Manhattan Beach, CA 90266 and is currently estimated at $4,808,307, approximately $1,380 per square foot. 751 26th St is a home located in Los Angeles County with nearby schools including Grand View Elementary School, Manhattan Beach Middle School, and Mira Costa High School.
Ownership History
Date
Name
Owned For
Owner Type
Purchase Details
Closed on
Dec 20, 2012
Sold by
Lee Howard R
Bought by
Lee Howard R and Lee Amy D
Current Estimated Value
Purchase Details
Closed on
Jun 15, 2012
Sold by
Lee Howard R and Lee Amy D
Bought by
Lee Howard R
Home Financials for this Owner
Home Financials are based on the most recent Mortgage that was taken out on this home.
Original Mortgage
$722,000
Outstanding Balance
$495,414
Interest Rate
3.62%
Mortgage Type
New Conventional
Estimated Equity
$4,312,893
Purchase Details
Closed on
Feb 7, 2011
Sold by
Phillips Roger D and Fisher Beth E
Bought by
Lee Howard R and Lee Amy D
Home Financials for this Owner
Home Financials are based on the most recent Mortgage that was taken out on this home.
Original Mortgage
$729,750
Interest Rate
4.84%
Mortgage Type
New Conventional
Purchase Details
Closed on
Dec 9, 2005
Sold by
Phillips Roger D and Fisher Beth E
Bought by
Phillips Roger D
Purchase Details
Closed on
Mar 21, 2005
Sold by
Lewis Howard B and Lewis Pamela A
Bought by
Phillips Roger D
Home Financials for this Owner
Home Financials are based on the most recent Mortgage that was taken out on this home.
Original Mortgage
$1,500,000
Interest Rate
5.5%
Mortgage Type
FHA
Purchase Details
Closed on
Jun 19, 2001
Sold by
Johnson Kenneth Eric and Johnson Carol Ann
Bought by
Lewis Howard B
Home Financials for this Owner
Home Financials are based on the most recent Mortgage that was taken out on this home.
Original Mortgage
$995,000
Interest Rate
7.15%
Purchase Details
Closed on
Jul 25, 2000
Sold by
Monk John Lawrence
Bought by
Johnson Kenneth Eric
Home Financials for this Owner
Home Financials are based on the most recent Mortgage that was taken out on this home.
Original Mortgage
$880,000
Interest Rate
8.12%
Mortgage Type
Construction
Create a Home Valuation Report for This Property
The Home Valuation Report is an in-depth analysis detailing your home's value as well as a comparison with similar homes in the area
Home Values in the Area
Average Home Value in this Area
Purchase History
| Date | Buyer | Sale Price | Title Company |
|---|---|---|---|
| Lee Howard R | -- | None Available | |
| Lee Howard R | -- | First American Title Company | |
| Lee Howard R | $1,755,000 | Progressive Title | |
| Phillips Roger D | -- | -- | |
| Phillips Roger D | $2,100,000 | Gateway Title Company | |
| Lewis Howard B | $1,475,000 | Investors Title Company | |
| Johnson Kenneth Eric | $650,000 | Commonwealth Title |
Source: Public Records
Mortgage History
| Date | Status | Borrower | Loan Amount |
|---|---|---|---|
| Open | Lee Howard R | $722,000 | |
| Closed | Lee Howard R | $729,750 | |
| Previous Owner | Phillips Roger D | $1,500,000 | |
| Previous Owner | Lewis Howard B | $995,000 | |
| Previous Owner | Johnson Kenneth Eric | $880,000 | |
| Closed | Phillips Roger D | $390,000 |
Source: Public Records
Tax History
| Year | Tax Paid | Tax Assessment Tax Assessment Total Assessment is a certain percentage of the fair market value that is determined by local assessors to be the total taxable value of land and additions on the property. | Land | Improvement |
|---|---|---|---|---|
| 2025 | $25,939 | $2,300,133 | $1,595,957 | $704,176 |
| 2024 | $25,939 | $2,255,033 | $1,564,664 | $690,369 |
| 2023 | $25,217 | $2,210,818 | $1,533,985 | $676,833 |
| 2022 | $24,781 | $2,167,469 | $1,503,907 | $663,562 |
| 2021 | $24,341 | $2,124,970 | $1,474,419 | $650,551 |
| 2019 | $23,687 | $2,061,944 | $1,430,688 | $631,256 |
| 2018 | $23,190 | $2,021,515 | $1,402,636 | $618,879 |
| 2016 | $21,558 | $1,943,020 | $1,348,171 | $594,849 |
| 2015 | $21,111 | $1,870,835 | $1,327,921 | $542,914 |
| 2014 | $20,352 | $1,834,189 | $1,301,909 | $532,280 |
Source: Public Records
Map
Nearby Homes
- 2623 Laurel Ave
- 3013 Maple Ave
- 2205 Pacific Ave
- 2917 N Poinsettia Ave
- 2921 N Poinsettia Ave
- 2100 Palm Ave
- 612 33rd St
- 3508 Maple Ave
- 2508 Pine Ave
- 3604 Laurel Ave
- 592 33rd St
- 3619 Laurel Ave
- 2317 Elm Ave
- 1801 Pine Ave
- 425 23rd Place
- 947 Manhattan Beach
- 844 14th St
- 1801 Oak Ave
- 966 Rosecrans Ave
- 2215 Alma Ave
Your Personal Tour Guide
Ask me questions while you tour the home.