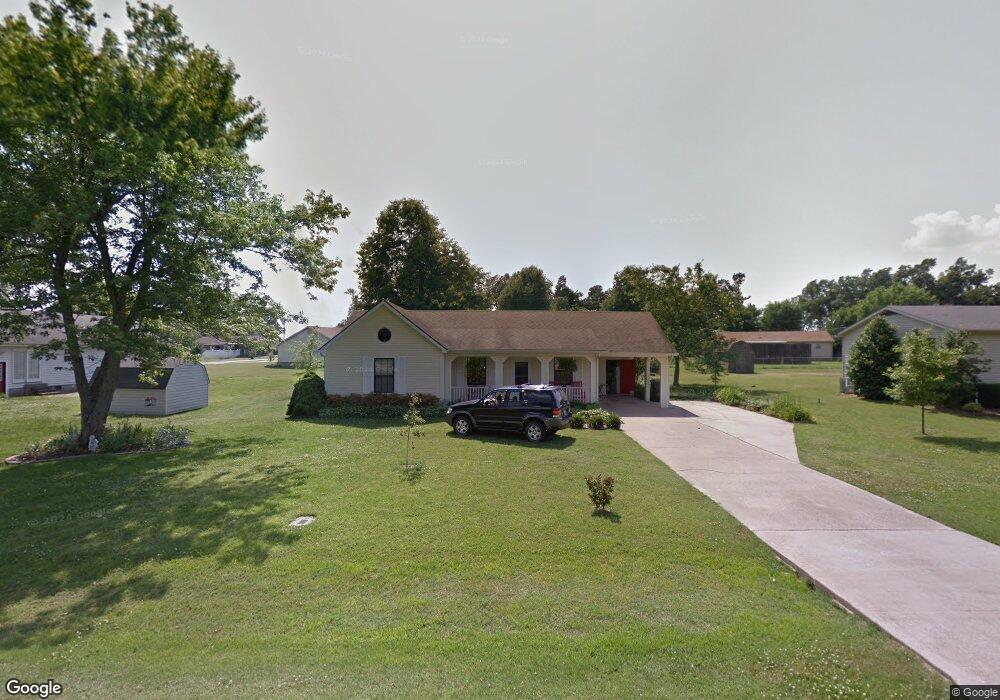
751 S Olive St Union City, TN 38261
Estimated Value: $165,887 - $193,000
--
Bed
2
Baths
1,142
Sq Ft
$157/Sq Ft
Est. Value
About This Home
This home is located at 751 S Olive St, Union City, TN 38261 and is currently estimated at $178,972, approximately $156 per square foot. 751 S Olive St is a home located in Obion County.
Ownership History
Date
Name
Owned For
Owner Type
Purchase Details
Closed on
May 3, 2000
Sold by
Chris Bolding
Bought by
Cooper John J
Current Estimated Value
Purchase Details
Closed on
Apr 9, 1998
Sold by
Jennings Jason D
Bought by
Chris Bolding
Purchase Details
Closed on
May 30, 1997
Sold by
Clayton Parker Robert
Bought by
Jennings Jason D
Purchase Details
Closed on
Apr 30, 1993
Bought by
Parker Robert Clayton and Tamara Kay
Purchase Details
Closed on
Feb 20, 1992
Bought by
Russ Charles W
Purchase Details
Closed on
May 16, 1991
Bought by
Federal Housing Admin (Fha)
Purchase Details
Closed on
Apr 5, 1988
Bought by
Hart Jacqueline F
Create a Home Valuation Report for This Property
The Home Valuation Report is an in-depth analysis detailing your home's value as well as a comparison with similar homes in the area
Home Values in the Area
Average Home Value in this Area
Purchase History
| Date | Buyer | Sale Price | Title Company |
|---|---|---|---|
| Cooper John J | $72,500 | -- | |
| Chris Bolding | $69,000 | -- | |
| Jennings Jason D | $59,000 | -- | |
| Parker Robert Clayton | $38,500 | -- | |
| Russ Charles W | -- | -- | |
| Federal Housing Admin (Fha) | -- | -- | |
| Hart Jacqueline F | -- | -- |
Source: Public Records
Tax History Compared to Growth
Tax History
| Year | Tax Paid | Tax Assessment Tax Assessment Total Assessment is a certain percentage of the fair market value that is determined by local assessors to be the total taxable value of land and additions on the property. | Land | Improvement |
|---|---|---|---|---|
| 2025 | -- | $40,325 | $0 | $0 |
| 2024 | -- | $40,325 | $3,750 | $36,575 |
| 2023 | $791 | $40,325 | $3,750 | $36,575 |
| 2022 | $678 | $24,200 | $2,000 | $22,200 |
| 2021 | $642 | $24,200 | $2,000 | $22,200 |
| 2020 | $464 | $17,500 | $2,000 | $15,500 |
| 2019 | $442 | $17,500 | $2,000 | $15,500 |
| 2018 | $442 | $17,500 | $2,000 | $15,500 |
| 2017 | $432 | $16,275 | $2,000 | $14,275 |
| 2016 | $432 | $16,275 | $2,000 | $14,275 |
| 2015 | $432 | $16,275 | $2,000 | $14,275 |
| 2014 | $432 | $16,275 | $2,000 | $14,275 |
Source: Public Records
Map
Nearby Homes
- 874 Gum St
- 915 Gum St
- 3611 W Main St
- 3412 Lakeview Dr
- 3305 Cottonwood Dr
- 560 Todd Thomas Rd
- 0 Burrus Rd
- 604 Denver Dr
- 2703 Salem Dr
- 3694 Pete Gray Rd
- 5680 Floyd Shuck Rd
- 210 Graham St
- 2235 Bel Air Cir
- 4478 Crystal Rd
- 1433 E County Home Rd
- 1428 Meadow Dr
- 922 N Division St
- 2610-2608 Nettle St
- 903 Sherwood Dr
- 841 Mosswood Dr