Estimated Value: $436,000 - $487,000
3
Beds
2
Baths
1,170
Sq Ft
$397/Sq Ft
Est. Value
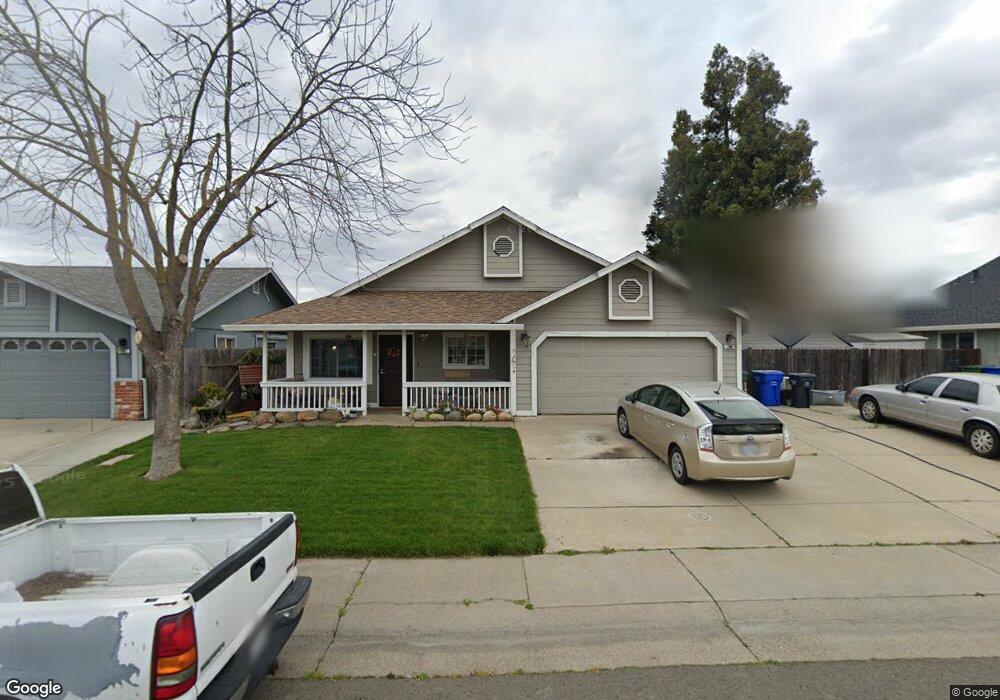
About This Home
This home is located at 751 Twin Hills Dr, Galt, CA 95632 and is currently estimated at $464,786, approximately $397 per square foot. 751 Twin Hills Dr is a home located in Sacramento County with nearby schools including Lake Canyon Elementary School, Robert L. McCaffrey Middle School, and Liberty Ranch High School.
Ownership History
Date
Name
Owned For
Owner Type
Purchase Details
Closed on
Feb 8, 2005
Sold by
Hopper San J and Teel San J
Bought by
Hopper Monti A and Hopper San J
Current Estimated Value
Home Financials for this Owner
Home Financials are based on the most recent Mortgage that was taken out on this home.
Original Mortgage
$210,000
Outstanding Balance
$107,161
Interest Rate
5.81%
Mortgage Type
New Conventional
Estimated Equity
$357,625
Purchase Details
Closed on
Mar 30, 1999
Sold by
Rodriguez Ruben and Aguirre Lisa R
Bought by
Teel San J
Purchase Details
Closed on
Jul 7, 1998
Sold by
Rural California Housing Corporation
Bought by
Rodriguez Ruben and Aguirre Lisa
Home Financials for this Owner
Home Financials are based on the most recent Mortgage that was taken out on this home.
Original Mortgage
$98,000
Interest Rate
7%
Create a Home Valuation Report for This Property
The Home Valuation Report is an in-depth analysis detailing your home's value as well as a comparison with similar homes in the area
Home Values in the Area
Average Home Value in this Area
Purchase History
We collect this data history from publicly available records. To have your information removed, we recommend requesting removal directly through your county’s website.
| Date | Buyer | Sale Price | Title Company |
|---|---|---|---|
| Hopper Monti A | -- | Commerce Title Company | |
| Teel San J | -- | Sacramento Title Company | |
| Rodriguez Ruben | $106,000 | Sacramento Title Company |
Source: Public Records
Mortgage History
We collect this data history from publicly available records. To have your information removed, we recommend requesting removal directly through your county’s website.
| Date | Status | Borrower | Loan Amount |
|---|---|---|---|
| Open | Hopper Monti A | $210,000 | |
| Previous Owner | Rodriguez Ruben | $98,000 | |
| Closed | Rodriguez Ruben | $8,000 |
Source: Public Records
Tax History
| Year | Tax Paid | Tax Assessment Tax Assessment Total Assessment is a certain percentage of the fair market value that is determined by local assessors to be the total taxable value of land and additions on the property. | Land | Improvement |
|---|---|---|---|---|
| 2025 | $2,707 | $243,969 | $47,019 | $196,950 |
| 2024 | $2,707 | $239,187 | $46,098 | $193,089 |
| 2023 | $2,661 | $234,498 | $45,195 | $189,303 |
| 2022 | $2,557 | $229,901 | $44,309 | $185,592 |
| 2021 | $2,558 | $225,394 | $43,441 | $181,953 |
| 2020 | $2,537 | $223,084 | $42,996 | $180,088 |
| 2019 | $2,475 | $218,710 | $42,153 | $176,557 |
| 2018 | $2,470 | $214,423 | $41,327 | $173,096 |
| 2017 | $2,375 | $210,219 | $40,517 | $169,702 |
| 2016 | $2,304 | $206,098 | $39,723 | $166,375 |
| 2015 | $2,508 | $203,003 | $39,127 | $163,876 |
| 2014 | $2,696 | $199,027 | $38,361 | $160,666 |
Source: Public Records
Map
Nearby Homes
- 954 Port Ashton Ct
- 958 Port Ashton Ct
- 787 Twin Hills Dr
- 692 Arlene Ct
- 709 Prairie Ct
- 724 Adare Way
- 829 Grizzly Mesa Ct
- 825 Polar Bear Cir
- 905 Millson Ct
- 1028 Beaver Park Way
- 877 Bateman Way
- 888 Koralla Way
- 851 Pecan Tree Ln
- 855 Pecan Tree Ln
- 859 Pecan Tree Ln
- 863 Pecan Tree Ln
- 856 Pecan Tree Ln
- 854 Pecan Tree Ln
- 852 Pecan Tree Ln
- 988 Padbury Ct
- 755 Twin Hills Dr
- 750 Elk Hills Dr
- 746 Elk Hills Dr
- 759 Twin Hills Dr
- 754 Elk Hills Dr
- 754 Twin Hills Dr
- 758 Twin Hills Dr
- 750 Twin Hills Dr
- 758 Elk Hills Dr
- 763 Twin Hills Dr
- 746 Twin Hills Dr
- 742 Elk Hills Dr
- 762 Elk Hills Dr
- 766 Twin Hills Dr
- 767 Twin Hills Dr
- 751 Elk Hills Dr
- 747 Elk Hills Dr
- 755 Elk Hills Dr
- 906 Fermoy Way
- 770 Twin Hills Dr
Your Personal Tour Guide
Ask me questions while you tour the home.