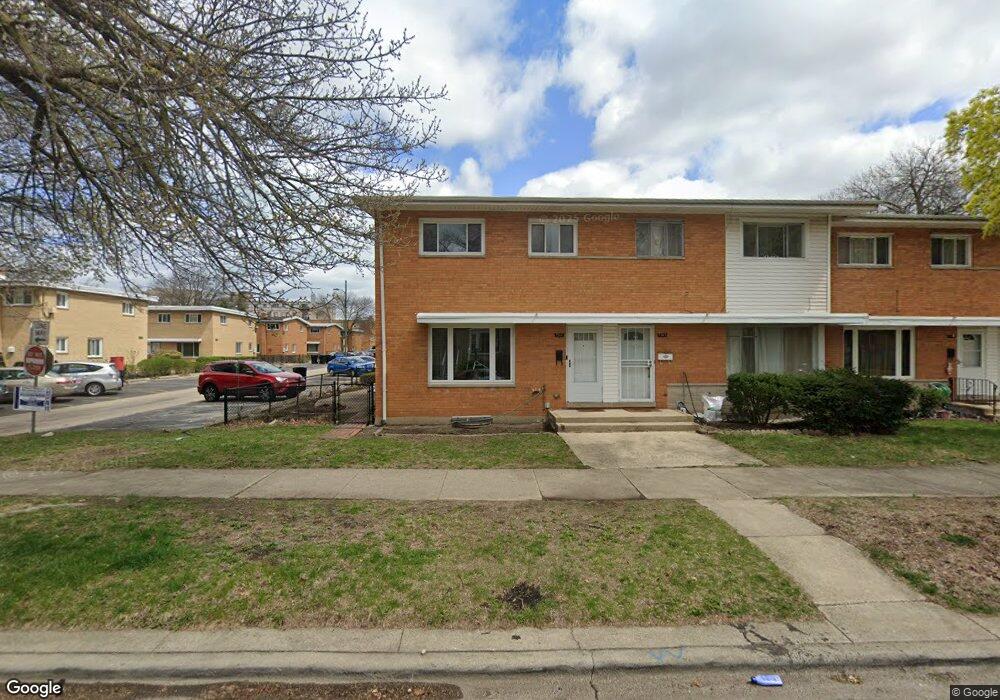
7511 N Rockwell St Chicago, IL 60645
West Ridge NeighborhoodEstimated Value: $330,341 - $367,000
3
Beds
2
Baths
1,280
Sq Ft
$267/Sq Ft
Est. Value
About This Home
This home is located at 7511 N Rockwell St, Chicago, IL 60645 and is currently estimated at $342,085, approximately $267 per square foot. 7511 N Rockwell St is a home located in Cook County with nearby schools including Rogers Elementary School, Mather High School, and Acero - Sor Juana Ines de la Cruz School.
Ownership History
Date
Name
Owned For
Owner Type
Purchase Details
Closed on
Nov 24, 2010
Sold by
Devon Bank
Bought by
Yahyanoorani Abufatah G and Jabeen Rabia
Current Estimated Value
Home Financials for this Owner
Home Financials are based on the most recent Mortgage that was taken out on this home.
Original Mortgage
$152,782
Interest Rate
4.65%
Mortgage Type
Seller Take Back
Purchase Details
Closed on
Apr 3, 2009
Sold by
Nelson Kathleen E and Nelson Richard L
Bought by
Nelson Kathleen E
Purchase Details
Closed on
Mar 30, 1999
Sold by
Bousquet Felix
Bought by
Nelson Betty H
Home Financials for this Owner
Home Financials are based on the most recent Mortgage that was taken out on this home.
Original Mortgage
$130,150
Interest Rate
7.28%
Purchase Details
Closed on
Mar 1, 1996
Sold by
Lazar Odisho P and Lazar Pauline T
Bought by
Bousquet Felix
Home Financials for this Owner
Home Financials are based on the most recent Mortgage that was taken out on this home.
Original Mortgage
$125,100
Interest Rate
7.07%
Create a Home Valuation Report for This Property
The Home Valuation Report is an in-depth analysis detailing your home's value as well as a comparison with similar homes in the area
Home Values in the Area
Average Home Value in this Area
Purchase History
| Date | Buyer | Sale Price | Title Company |
|---|---|---|---|
| Yahyanoorani Abufatah G | -- | Cti | |
| Devon Bank | $170,000 | Cti | |
| Nelson Kathleen E | -- | Chicago Title Insurance Co | |
| Nelson Betty H | $137,000 | -- | |
| Bousquet Felix | $208,500 | 1St American Title |
Source: Public Records
Mortgage History
| Date | Status | Borrower | Loan Amount |
|---|---|---|---|
| Previous Owner | Yahyanoorani Abufatah G | $152,782 | |
| Previous Owner | Nelson Betty H | $130,150 | |
| Previous Owner | Bousquet Felix | $125,100 |
Source: Public Records
Tax History Compared to Growth
Tax History
| Year | Tax Paid | Tax Assessment Tax Assessment Total Assessment is a certain percentage of the fair market value that is determined by local assessors to be the total taxable value of land and additions on the property. | Land | Improvement |
|---|---|---|---|---|
| 2024 | $4,224 | $25,001 | $7,173 | $17,828 |
| 2023 | $4,092 | $24,000 | $5,738 | $18,262 |
| 2022 | $4,092 | $24,000 | $5,738 | $18,262 |
| 2021 | $4,023 | $24,000 | $5,738 | $18,262 |
| 2020 | $3,559 | $19,697 | $4,160 | $15,537 |
| 2019 | $3,703 | $21,862 | $4,160 | $17,702 |
| 2018 | $3,640 | $21,862 | $4,160 | $17,702 |
| 2017 | $2,626 | $15,573 | $3,729 | $11,844 |
| 2016 | $2,619 | $15,573 | $3,729 | $11,844 |
| 2015 | $2,373 | $15,573 | $3,729 | $11,844 |
| 2014 | $2,524 | $16,174 | $3,442 | $12,732 |
| 2013 | $2,463 | $16,174 | $3,442 | $12,732 |
Source: Public Records
Map
Nearby Homes
- 1615 W Howard St Unit 303
- 7433 N Washtenaw Ave
- 2522 W Jarvis Ave
- 1406 Brummel St
- 7546 N Oakley Ave
- 2256 W Birchwood Ave
- 215 Brown Ave
- 309 Darrow Ave
- 2650 W Touhy Ave
- 2011 Brummel St
- 7315 N Oakley Ave Unit 1A
- 347 Florence Ave
- 401 Dewey Ave
- 7540 N Ridge Blvd Unit 5C
- 7540 N Ridge Blvd Unit 5D
- 7348 N Ridge Blvd Unit 16B
- 235 Richmond St
- 7252 N Bell Ave
- 7344 N Ridge Blvd Unit 5C
- 7223 N Oakley Ave Unit 1E
- 7507 N Rockwell St
- 7505 N Rockwell St
- 7515 N Rockwell St
- 2544 W Birchwood Ave
- 2544 W Birchwood Ave
- 2544 W Birchwood Ave
- 2544 W Birchwood Ave
- 2544 W Birchwood Ave Unit B
- 7501 N Rockwell St
- 7517 N Rockwell St
- 7521 N Rockwell St
- 2538 W Birchwood Ave
- 2538 W Birchwood Ave
- 2538 W Birchwood Ave
- 2547 W Jerome St
- 2547 W Jerome St
- 2547 W Jerome St
- 2547 W Jerome St
- 2547 W Jerome St Unit D
- 7525 N Rockwell St