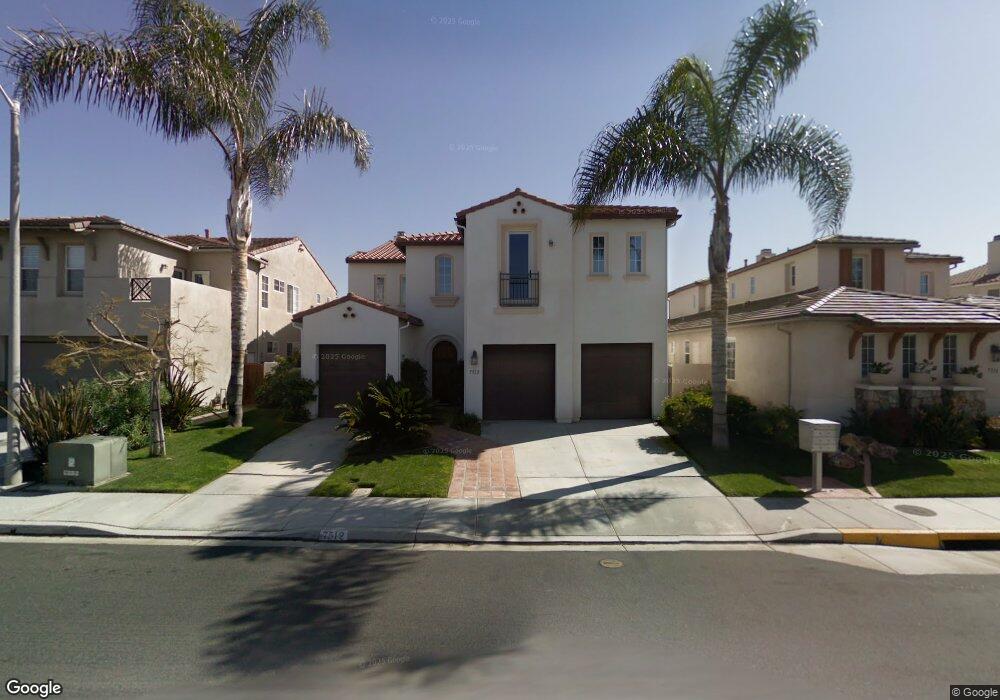
7512 Magellan St Carlsbad, CA 92011
South Beach NeighborhoodEstimated Value: $2,412,000 - $2,741,000
5
Beds
4
Baths
3,501
Sq Ft
$731/Sq Ft
Est. Value
About This Home
This home is located at 7512 Magellan St, Carlsbad, CA 92011 and is currently estimated at $2,559,624, approximately $731 per square foot. 7512 Magellan St is a home located in San Diego County with nearby schools including Pacific Rim Elementary, Aviara Oaks Middle, and Carlsbad High School.
Ownership History
Date
Name
Owned For
Owner Type
Purchase Details
Closed on
Jul 21, 2020
Sold by
Niehaus Andrea L and Niehaus Robert L
Bought by
Niehaus Robert L and Niehaus Andrea L
Current Estimated Value
Purchase Details
Closed on
Mar 28, 2003
Sold by
Niehaus Robert L and Niehaus Andrea L
Bought by
Niehaus Robert L and Niehaus Andrea L
Home Financials for this Owner
Home Financials are based on the most recent Mortgage that was taken out on this home.
Original Mortgage
$595,000
Interest Rate
5.78%
Purchase Details
Closed on
Sep 28, 1999
Sold by
Greystone Homes
Bought by
Niehaus Robert L and Niehaus Andrea L
Home Financials for this Owner
Home Financials are based on the most recent Mortgage that was taken out on this home.
Original Mortgage
$462,350
Interest Rate
7.76%
Create a Home Valuation Report for This Property
The Home Valuation Report is an in-depth analysis detailing your home's value as well as a comparison with similar homes in the area
Home Values in the Area
Average Home Value in this Area
Purchase History
We collect this data history from publicly available records. To have your information removed, we recommend requesting removal directly through your county’s website.
| Date | Buyer | Sale Price | Title Company |
|---|---|---|---|
| Niehaus Robert L | -- | None Available | |
| Niehaus Robert L | -- | Stewart Title Of Ca Inc | |
| Niehaus Robert L | $578,000 | North American Title Co |
Source: Public Records
Mortgage History
We collect this data history from publicly available records. To have your information removed, we recommend requesting removal directly through your county’s website.
| Date | Status | Borrower | Loan Amount |
|---|---|---|---|
| Previous Owner | Niehaus Robert L | $595,000 | |
| Previous Owner | Niehaus Robert L | $462,350 |
Source: Public Records
Tax History
| Year | Tax Paid | Tax Assessment Tax Assessment Total Assessment is a certain percentage of the fair market value that is determined by local assessors to be the total taxable value of land and additions on the property. | Land | Improvement |
|---|---|---|---|---|
| 2025 | $9,988 | $888,354 | $345,809 | $542,545 |
| 2024 | $9,988 | $870,936 | $339,029 | $531,907 |
| 2023 | $9,940 | $853,860 | $332,382 | $521,478 |
| 2022 | $9,797 | $837,118 | $325,865 | $511,253 |
| 2021 | $9,727 | $820,705 | $319,476 | $501,229 |
| 2020 | $9,666 | $812,291 | $316,201 | $496,090 |
| 2019 | $9,504 | $796,364 | $310,001 | $486,363 |
| 2018 | $9,132 | $780,750 | $303,923 | $476,827 |
| 2017 | $8,991 | $765,442 | $297,964 | $467,478 |
| 2016 | $8,658 | $750,434 | $292,122 | $458,312 |
| 2015 | $8,626 | $739,163 | $287,735 | $451,428 |
| 2014 | $8,493 | $724,685 | $282,099 | $442,586 |
Source: Public Records
Map
Nearby Homes
- 7521 Navigator Cir
- 7354 Escallonia Ct
- 7301 Seafarer Place
- 7327 Linden Terrace
- 7302 Lantana Terrace
- 2071 W Pearl St
- 2059 W Pearl St
- 2053 W Pearl St
- 7233 San Bartolo St Unit 376
- 7305 San Bartolo St Unit 374
- 7236 San Benito St Unit 355
- 7320 San Bartolo St Unit 217
- 7326 San Bartolo St Unit 220
- 7302 Santa Barbara St Unit 323
- 7241 San Luis St
- 7269 San Luis St Unit 244
- 7313 Santa Barbara St Unit 294
- 7315 San Luis St Unit 235
- 7209 San Luis St Unit 169
- 7025 San Bartolo St Unit 42
- 7508 Magellan St
- 7516 Magellan St
- 7504 Magellan St
- 7520 Magellan St
- 531 Rudder Ave
- 7500 Magellan St
- 7524 Magellan St
- 7519 Magellan St
- 536 Rudder Ave
- 7597 Navigator Cir
- 7595 Navigator Cir
- 527 Rudder Ave
- 540 Rudder Ave
- 7523 Magellan St
- 7528 Magellan St
- 7593 Navigator Cir
- 541 Halsing Ct
- 7527 Magellan St
- 7532 Magellan St
- 7591 Navigator Cir
Your Personal Tour Guide
Ask me questions while you tour the home.