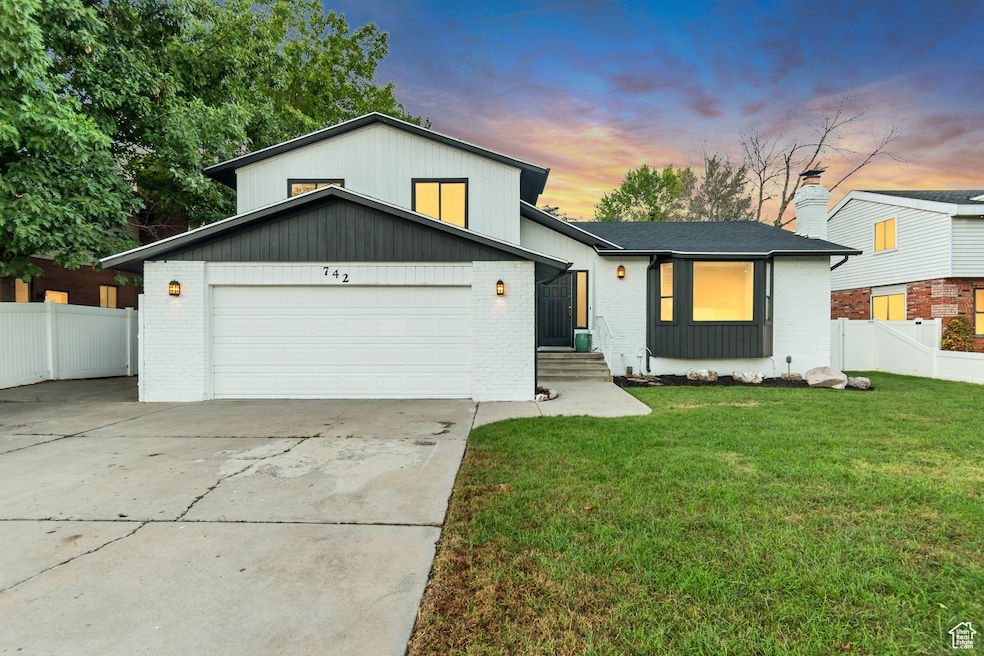
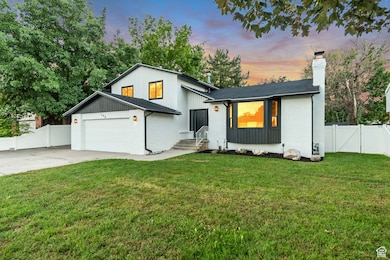
752 E Chad Cir Midvale, UT 84047
Estimated payment $3,524/month
Highlights
- RV or Boat Parking
- Mature Trees
- Secluded Lot
- Oakdale School Rated A
- Mountain View
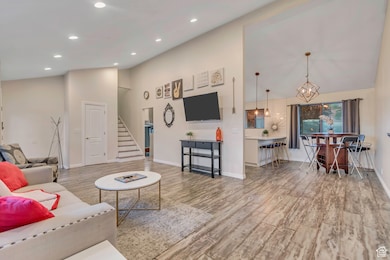
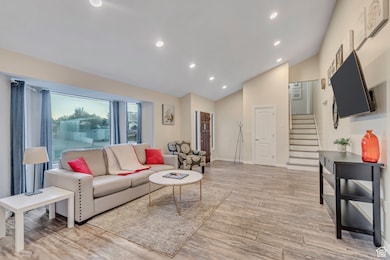
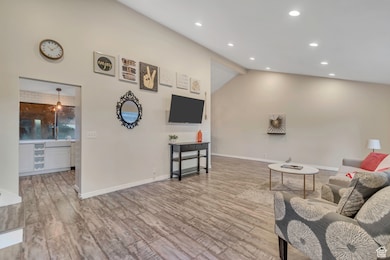
- Vaulted Ceiling
About This Home
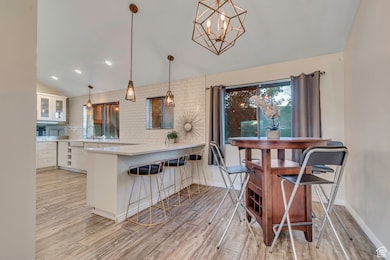
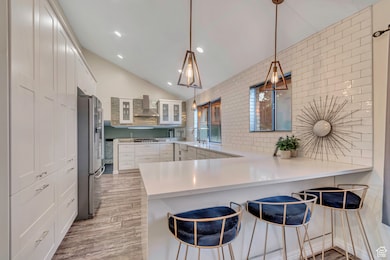
**PRICE IMPROVED**Welcome to 752 Chad Circle. BRAND NEW ROOF AND WHOLE HOME PAINTED IN AUGUST!! This spacious home offers a recently remodeled kitchen, basement apartment with separate kitchen and backyard that is perfect for entertaining. **SELLER HAS BID IN HAND TO REPLACE WINDOWS** Seller is offering a concession at close to pay for window replacement. Huge family room with vaulted ceilings. Home was just painted and the roof replaced! Move in ready or make it your own. Located on the east bench in a circle and close to schools, shopping, dining and freeway access. Set up your private tour today! 752 Chad circle but numbers on home and on postal record is 742.

Home Details
Home Type
- Single Family
Est. Annual Taxes
- $3,056
Year Built
- Built in 1978
Lot Details
- 7,841 Sq Ft Lot
- Property is Fully Fenced
- Landscaped
- Secluded Lot
- Sprinkler System
- Mature Trees
- Property is zoned Single-Family
Parking
- 2 Car Attached Garage
- 6 Open Parking Spaces
- RV or Boat Parking
Home Design
- Brick Exterior Construction
- Cedar
Interior Spaces
- 2,577 Sq Ft Home
- 3-Story Property
- Vaulted Ceiling
- 2 Fireplaces
- Double Pane Windows
- Blinds
- Mountain Views
- Partial Basement
- Electric Dryer Hookup
Kitchen
- Microwave
- Disposal
Flooring
- Carpet
- Laminate
- Vinyl
Bedrooms and Bathrooms
- 5 Bedrooms
Schools
- Oakdale Elementary School
- Union Middle School
- Hillcrest High School
Utilities
- Central Heating and Cooling System
- Heating System Uses Wood
- Natural Gas Connected
Community Details
- No Home Owners Association
- Mid Valley Estates Subdivision
Listing and Financial Details
- Exclusions: Dryer, Washer
- Assessor Parcel Number 22-29-354-003
Map
Home Values in the Area
Average Home Value in this Area
Tax History
| Year | Tax Paid | Tax Assessment Tax Assessment Total Assessment is a certain percentage of the fair market value that is determined by local assessors to be the total taxable value of land and additions on the property. | Land | Improvement |
|---|---|---|---|---|
| 2025 | $3,056 | $533,200 | $128,700 | $404,500 |
| 2024 | $3,056 | $501,800 | $120,300 | $381,500 |
| 2023 | $3,084 | $501,700 | $114,400 | $387,300 |
| 2022 | $3,226 | $512,700 | $112,100 | $400,600 |
| 2021 | $2,850 | $387,200 | $97,500 | $289,700 |
| 2020 | $2,749 | $353,500 | $85,800 | $267,700 |
| 2019 | $2,523 | $316,000 | $85,800 | $230,200 |
| 2018 | $2,390 | $302,800 | $85,800 | $217,000 |
| 2017 | $2,166 | $263,700 | $78,000 | $185,700 |
| 2016 | $1,995 | $214,100 | $78,000 | $136,100 |
| 2015 | $1,495 | $173,500 | $75,700 | $97,800 |
| 2014 | $1,448 | $164,200 | $73,300 | $90,900 |
Property History
| Date | Event | Price | List to Sale | Price per Sq Ft |
|---|---|---|---|---|
| 11/30/2025 11/30/25 | Pending | -- | -- | -- |
| 11/07/2025 11/07/25 | Price Changed | $624,000 | -0.8% | $242 / Sq Ft |
| 09/27/2025 09/27/25 | For Sale | $629,000 | -- | $244 / Sq Ft |
Purchase History
| Date | Type | Sale Price | Title Company |
|---|---|---|---|
| Warranty Deed | -- | Vanguard Title | |
| Warranty Deed | -- | Bonneville Superior Title | |
| Warranty Deed | -- | Highland Title Agency |
Mortgage History
| Date | Status | Loan Amount | Loan Type |
|---|---|---|---|
| Open | $298,300 | New Conventional | |
| Previous Owner | $265,109 | FHA | |
| Previous Owner | $144,000 | New Conventional |
Source: UtahRealEstate.com
MLS Number: 2114278
APN: 22-29-354-003-0000
Disclaimer: Certain information contained herein is derived from information provided by parties other than Homes.com. All information provided is deemed reliable, but is not guaranteed to be accurate and should be independently verified.
![]() IDX information is provided exclusively for consumers’ personal, non-commercial use, that it may not be used for any purpose other than to identify prospective properties consumers may be interested in purchasing, and that the data is deemed reliable but is not guaranteed accurate by the MLS. Licensor is only providing the MLS Content and not other sources of data provided in the Product.
IDX information is provided exclusively for consumers’ personal, non-commercial use, that it may not be used for any purpose other than to identify prospective properties consumers may be interested in purchasing, and that the data is deemed reliable but is not guaranteed accurate by the MLS. Licensor is only providing the MLS Content and not other sources of data provided in the Product.
Based on information from the Wasatch Front Regional Multiple Listing Service, Inc.. All data, including all measurements and calculations of area, is obtained from various sources and has not been, and will not be, verified by broker or the MLS. All information should be independently reviewed and verified for accuracy. Properties may or may not be listed by the office/agent presenting the information.
- 7709 S Sunbird Way
- 610 E 7570 S
- 7825 S Spruce Tree Ln
- 7579 S 520 E
- 472 E 7670 S
- 909 E 7865 S
- 972 E 7725 S
- 696 E Union Garden Ct
- 7436 S Launa St
- 7964 S 860 E
- 5766 Sandy Woods Cir
- 7614 S 1000 E
- 963 E Taliesen Cove Unit 104
- 973 E Taliesen Cove Unit 203
- 760 E 8080 S
- 7327 S Springcrest Ct Unit 10
- 931 E Creekhill Ln Unit 11
- 925 E Creekhill Ln Unit 11
- 955 E Creekhill Ln Unit 31
- 795 E 8125 S