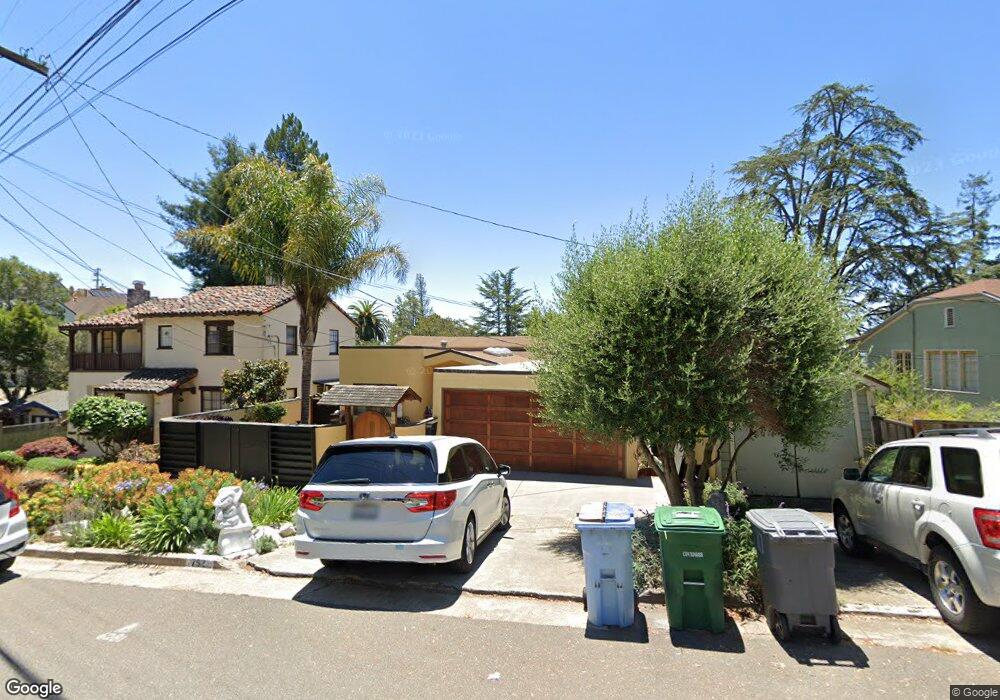
752 Euclid Ave Berkeley, CA 94708
Berkeley Hills NeighborhoodEstimated Value: $1,829,000 - $2,454,000
6
Beds
3
Baths
3,447
Sq Ft
$662/Sq Ft
Est. Value
About This Home
This home is located at 752 Euclid Ave, Berkeley, CA 94708 and is currently estimated at $2,280,830, approximately $661 per square foot. 752 Euclid Ave is a home located in Alameda County with nearby schools including Cragmont Elementary School, Berkeley Arts Magnet at Whittier School, and Washington Elementary School.
Ownership History
Date
Name
Owned For
Owner Type
Purchase Details
Closed on
Jan 24, 2024
Sold by
Shurman Michele P and Shurman Philip A
Bought by
Philip And Michele Schurman Living Trust and Schurman
Current Estimated Value
Purchase Details
Closed on
Jun 10, 2005
Sold by
Schurman Philip A and Schurman Michele P
Bought by
Schurman Philip A and Schurman Michele P
Home Financials for this Owner
Home Financials are based on the most recent Mortgage that was taken out on this home.
Original Mortgage
$850,000
Interest Rate
4.87%
Mortgage Type
Purchase Money Mortgage
Purchase Details
Closed on
Sep 1, 1998
Sold by
Blakeney Charles D and Blakeney Ronnie A
Bought by
Schurman Philip A and Schurman Michele P
Home Financials for this Owner
Home Financials are based on the most recent Mortgage that was taken out on this home.
Original Mortgage
$460,000
Interest Rate
6.92%
Create a Home Valuation Report for This Property
The Home Valuation Report is an in-depth analysis detailing your home's value as well as a comparison with similar homes in the area
Home Values in the Area
Average Home Value in this Area
Purchase History
| Date | Buyer | Sale Price | Title Company |
|---|---|---|---|
| Philip And Michele Schurman Living Trust | -- | None Listed On Document | |
| Schurman Philip A | -- | Placer Title Company | |
| Schurman Philip A | $575,000 | Placer Title Company |
Source: Public Records
Mortgage History
| Date | Status | Borrower | Loan Amount |
|---|---|---|---|
| Previous Owner | Schurman Philip A | $850,000 | |
| Previous Owner | Schurman Philip A | $460,000 |
Source: Public Records
Tax History
| Year | Tax Paid | Tax Assessment Tax Assessment Total Assessment is a certain percentage of the fair market value that is determined by local assessors to be the total taxable value of land and additions on the property. | Land | Improvement |
|---|---|---|---|---|
| 2025 | $15,621 | $894,381 | $270,414 | $630,967 |
| 2024 | $15,621 | $876,711 | $265,113 | $618,598 |
| 2023 | $15,274 | $859,386 | $259,916 | $606,470 |
| 2022 | $14,949 | $842,401 | $254,820 | $594,581 |
| 2021 | $14,956 | $825,748 | $249,824 | $582,924 |
| 2020 | $14,016 | $824,210 | $247,263 | $576,947 |
| 2019 | $13,321 | $808,052 | $242,415 | $565,637 |
| 2018 | $13,067 | $792,211 | $237,663 | $554,548 |
| 2017 | $12,614 | $776,680 | $233,004 | $543,676 |
| 2016 | $12,118 | $761,454 | $228,436 | $533,018 |
| 2015 | $11,941 | $750,017 | $225,005 | $525,012 |
| 2014 | $11,772 | $735,327 | $220,598 | $514,729 |
Source: Public Records
Map
Nearby Homes
- 890 Keeler Ave
- 758 Spruce St
- 731 Grizzly Peak Blvd
- 770 Santa Barbara Rd
- 614 Cragmont Ave
- 813 San Diego Rd
- 935 Grizzly Peak Blvd
- 826 Indian Rock Ave
- 962 Regal Rd
- 982 Grizzly Peak Blvd
- 1024 Miller Ave
- 765 San Diego Rd
- 1024 Grizzly Peak Blvd
- 1983 Yosemite Rd
- 1106 Cragmont Ave
- 589 San Luis Rd
- 410 Grizzly Peak Blvd
- 483 Boynton Ave
- 1100 Miller Ave
- 1040 Park Hills Rd
Your Personal Tour Guide
Ask me questions while you tour the home.