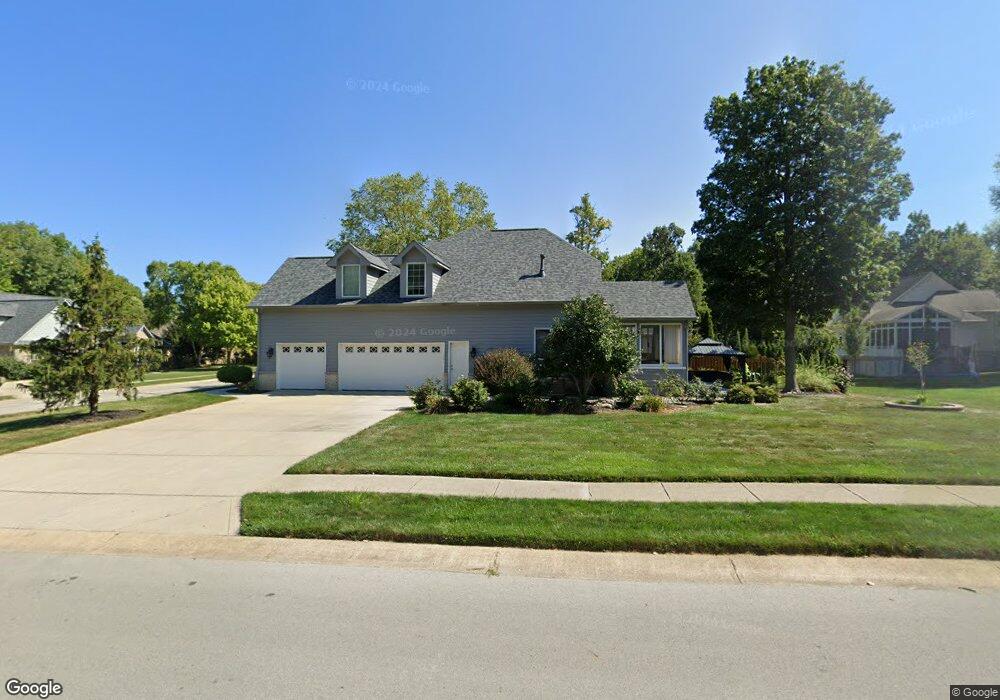
7528 Easy St Fishers, IN 46038
Estimated Value: $473,000 - $573,000
4
Beds
3
Baths
2,582
Sq Ft
$207/Sq Ft
Est. Value
About This Home
This home is located at 7528 Easy St, Fishers, IN 46038 and is currently estimated at $533,615, approximately $206 per square foot. 7528 Easy St is a home located in Hamilton County with nearby schools including Fishers Elementary School, Riverside Junior High School, and Riverside Intermediate School.
Ownership History
Date
Name
Owned For
Owner Type
Purchase Details
Closed on
Feb 13, 2008
Sold by
Ameriquest Funding Ii Reo Subsidiary Llc
Bought by
Le Hanh B
Current Estimated Value
Home Financials for this Owner
Home Financials are based on the most recent Mortgage that was taken out on this home.
Original Mortgage
$212,000
Interest Rate
5.75%
Mortgage Type
Purchase Money Mortgage
Purchase Details
Closed on
Nov 19, 2007
Sold by
Hairston Dyrll
Bought by
Argent Mortgage Co Llc
Purchase Details
Closed on
Nov 5, 2007
Sold by
Argent Mortgage Co Llc
Bought by
Ameriquest Funding Ii Reo Subsidiary Llc
Purchase Details
Closed on
Feb 21, 2002
Sold by
Wintercove Llc
Bought by
Hitzemann Carl and Hitzemann Gina
Home Financials for this Owner
Home Financials are based on the most recent Mortgage that was taken out on this home.
Original Mortgage
$208,000
Interest Rate
6.92%
Mortgage Type
Purchase Money Mortgage
Create a Home Valuation Report for This Property
The Home Valuation Report is an in-depth analysis detailing your home's value as well as a comparison with similar homes in the area
Home Values in the Area
Average Home Value in this Area
Purchase History
| Date | Buyer | Sale Price | Title Company |
|---|---|---|---|
| Le Hanh B | -- | None Available | |
| Argent Mortgage Co Llc | $295,475 | None Available | |
| Ameriquest Funding Ii Reo Subsidiary Llc | -- | None Available | |
| Hitzemann Carl | -- | -- |
Source: Public Records
Mortgage History
| Date | Status | Borrower | Loan Amount |
|---|---|---|---|
| Closed | Le Hanh B | $212,000 | |
| Previous Owner | Hitzemann Carl | $208,000 |
Source: Public Records
Tax History
| Year | Tax Paid | Tax Assessment Tax Assessment Total Assessment is a certain percentage of the fair market value that is determined by local assessors to be the total taxable value of land and additions on the property. | Land | Improvement |
|---|---|---|---|---|
| 2025 | $5,261 | $457,800 | $152,000 | $305,800 |
| 2024 | $5,103 | $454,300 | $152,000 | $302,300 |
| 2023 | $5,103 | $441,600 | $107,100 | $334,500 |
| 2022 | $4,751 | $399,000 | $107,100 | $291,900 |
| 2021 | $4,215 | $351,800 | $107,100 | $244,700 |
| 2020 | $4,114 | $342,400 | $107,100 | $235,300 |
| 2019 | $4,089 | $340,300 | $71,200 | $269,100 |
| 2018 | $4,066 | $329,000 | $71,200 | $257,800 |
| 2017 | $3,900 | $329,500 | $71,200 | $258,300 |
| 2016 | $3,969 | $335,400 | $71,200 | $264,200 |
| 2014 | $3,445 | $317,500 | $71,200 | $246,300 |
| 2013 | $3,445 | $320,300 | $71,300 | $249,000 |
Source: Public Records
Map
Nearby Homes
- 11130 Vineyard Dr
- 11139 Tisbury Ct
- 11132 Seabury Ct
- 7303 Lightship Ct
- 7591 Timber Springs Dr
- 526 Conner Creek Dr
- 524 Conner Creek Dr
- 11303 Hartford Ln
- 11515 Timberlake Ln
- 518 Concord Ct
- 6680 Easy St
- 7678 Colonial Ct
- 7611 E 116th St
- 7750 Garrick St
- 7175 Woodgate Dr
- 11288 Ashley Place
- 7511 Madden Dr
- 11374 Cherry Blossom East Dr
- 6896 Cherry Laurel Ln
- 6815 Cherry Laurel Ln
- 10893 Wintercove Way
- 10895 Wintercove Way
- 10812 Moors End Cir
- 7529 Easy St
- 10824 Moors End Cir
- 10910 Wintercove Way
- 7513 Easy St
- 10909 Wintercove Way
- 7498 Easy St
- 7497 Easy St
- 10926 Wintercove Way
- 10836 Moors End Cir
- 10794 Northhampton Dr
- 10811 Moors End Cir
- 7486 Easy St
- 7482 Easy St
- 7481 Easy St
- 9999 Sloop Cir
- 7561 Autumn Frost Cir
- 10942 Wintercove Way
Your Personal Tour Guide
Ask me questions while you tour the home.