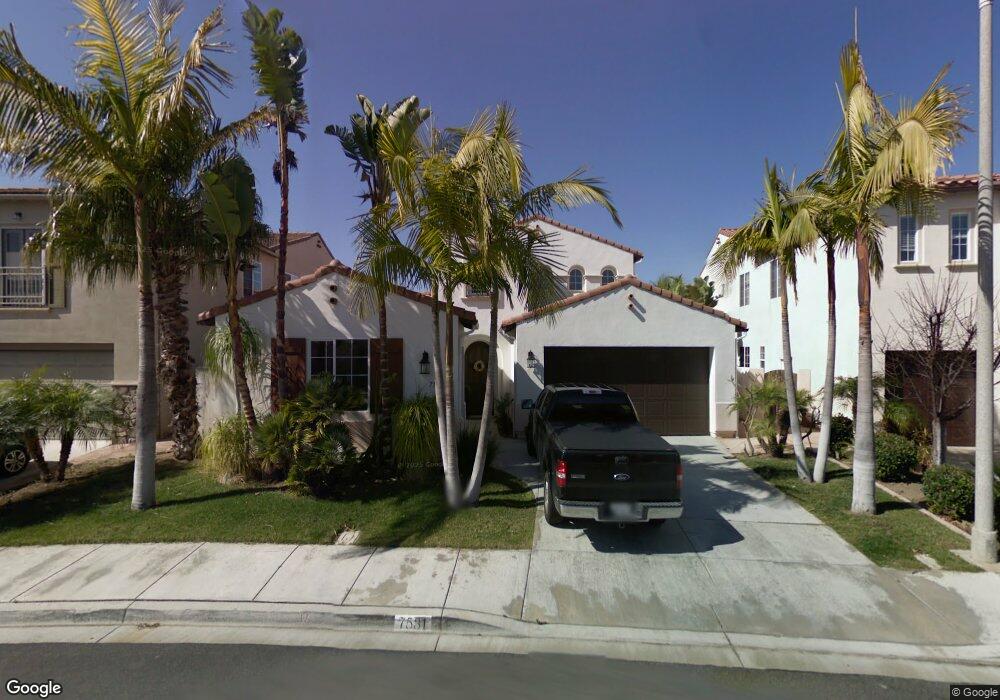
7531 Magellan St Carlsbad, CA 92011
South Beach NeighborhoodEstimated Value: $2,102,946 - $2,394,000
4
Beds
3
Baths
2,970
Sq Ft
$755/Sq Ft
Est. Value
About This Home
This home is located at 7531 Magellan St, Carlsbad, CA 92011 and is currently estimated at $2,243,237, approximately $755 per square foot. 7531 Magellan St is a home located in San Diego County with nearby schools including Pacific Rim Elementary, Aviara Oaks Middle, and Carlsbad High School.
Ownership History
Date
Name
Owned For
Owner Type
Purchase Details
Closed on
Aug 20, 2007
Sold by
Hecker Dean L
Bought by
Hecker Dean L and Dean L Hecker Revocable Trust
Current Estimated Value
Purchase Details
Closed on
Aug 26, 2005
Sold by
Griffin Victoria L
Bought by
Griffin John J and Griffin Victoria L
Purchase Details
Closed on
Jun 1, 2000
Sold by
Griffin John J
Bought by
Griffin Victoria L
Purchase Details
Closed on
Mar 24, 2000
Sold by
Greystone Homes
Bought by
Griffin Victoria L
Home Financials for this Owner
Home Financials are based on the most recent Mortgage that was taken out on this home.
Original Mortgage
$419,200
Interest Rate
8.67%
Create a Home Valuation Report for This Property
The Home Valuation Report is an in-depth analysis detailing your home's value as well as a comparison with similar homes in the area
Home Values in the Area
Average Home Value in this Area
Purchase History
| Date | Buyer | Sale Price | Title Company |
|---|---|---|---|
| Hecker Dean L | -- | None Available | |
| Griffin John J | -- | United Title Company | |
| Griffin Victoria L | -- | North American Title Co | |
| Griffin Victoria L | $524,000 | North American Title Co |
Source: Public Records
Mortgage History
| Date | Status | Borrower | Loan Amount |
|---|---|---|---|
| Previous Owner | Griffin Victoria L | $419,200 | |
| Closed | Griffin Victoria L | $52,400 |
Source: Public Records
Tax History
| Year | Tax Paid | Tax Assessment Tax Assessment Total Assessment is a certain percentage of the fair market value that is determined by local assessors to be the total taxable value of land and additions on the property. | Land | Improvement |
|---|---|---|---|---|
| 2025 | $8,982 | $789,569 | $346,566 | $443,003 |
| 2024 | $8,982 | $774,088 | $339,771 | $434,317 |
| 2023 | $8,939 | $758,910 | $333,109 | $425,801 |
| 2022 | $8,812 | $744,030 | $326,578 | $417,452 |
| 2021 | $8,750 | $729,442 | $320,175 | $409,267 |
| 2020 | $8,696 | $721,963 | $316,892 | $405,071 |
| 2019 | $8,551 | $707,808 | $310,679 | $397,129 |
| 2018 | $8,221 | $693,931 | $304,588 | $389,343 |
| 2017 | $8,096 | $680,325 | $298,616 | $381,709 |
| 2016 | $7,800 | $666,986 | $292,761 | $374,225 |
| 2015 | $7,771 | $656,968 | $288,364 | $368,604 |
| 2014 | $7,652 | $644,100 | $282,716 | $361,384 |
Source: Public Records
Map
Nearby Homes
- 7521 Navigator Cir
- 7393 Portage Way
- 7354 Escallonia Ct
- 2071 W Pearl St
- 2067 W Pearl St
- 917 Anatra Ct
- 2079 E Pearl St
- 7233 San Bartolo St Unit 376
- 7311 San Luis St Unit 237
- 7305 San Bartolo St Unit 374
- 7236 San Benito St Unit 355
- 7320 San Bartolo St Unit 217
- 7302 Santa Barbara St Unit 323
- 7241 San Luis St
- 7326 San Bartolo St Unit 220
- 7269 San Luis St Unit 244
- 7313 Santa Barbara St Unit 294
- 7315 San Luis St Unit 235
- 7025 San Bartolo St Unit 42
- 7243 San Luis St Unit 257
- 7535 Magellan St
- 7527 Magellan St
- 517 Knots Ln
- 7523 Magellan St
- 513 Knots Ln
- 520 Stern Way
- 524 Stern Way
- 522 Knots Ln
- 516 Stern Way
- 7532 Magellan St
- 7528 Magellan St
- 7519 Magellan St
- 7536 Magellan St
- 7524 Magellan St
- 518 Knots Ln
- 512 Stern Way
- 7540 Magellan St
- 514 Knots Ln
- 7520 Magellan St
- 509 Knots Ln
Your Personal Tour Guide
Ask me questions while you tour the home.