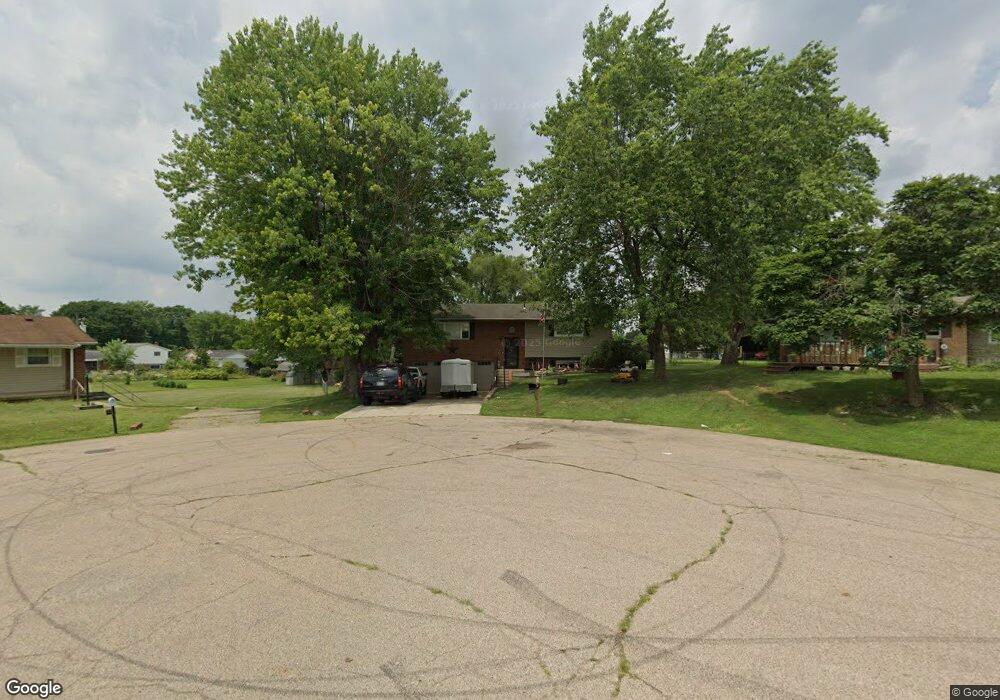
7534 Finch Ct Franklin, OH 45005
Estimated Value: $250,771 - $266,000
3
Beds
2
Baths
1,192
Sq Ft
$217/Sq Ft
Est. Value
About This Home
This home is located at 7534 Finch Ct, Franklin, OH 45005 and is currently estimated at $258,693, approximately $217 per square foot. 7534 Finch Ct is a home located in Warren County with nearby schools including Alden R Brown Elementary School, Chamberlain Middle School, and Carlisle High School.
Ownership History
Date
Name
Owned For
Owner Type
Purchase Details
Closed on
Aug 29, 2006
Sold by
Hud
Bought by
Obryan Jason Eric and Obryan Sarah Beth
Current Estimated Value
Home Financials for this Owner
Home Financials are based on the most recent Mortgage that was taken out on this home.
Original Mortgage
$113,715
Outstanding Balance
$66,883
Interest Rate
6.77%
Mortgage Type
FHA
Estimated Equity
$191,810
Purchase Details
Closed on
Apr 27, 2006
Sold by
Abn Amro Mortgage Group Inc
Bought by
Hud
Purchase Details
Closed on
Jan 13, 2006
Sold by
Baker John H and Case #04Cv62913
Bought by
Abn Amro Mortgage Group Inc
Purchase Details
Closed on
Jun 17, 1988
Sold by
Baker Jack V and Baker Betty E
Bought by
Baker and Baker John H
Purchase Details
Closed on
Nov 3, 1980
Sold by
Cordell Cordell and Cordell Harry
Create a Home Valuation Report for This Property
The Home Valuation Report is an in-depth analysis detailing your home's value as well as a comparison with similar homes in the area
Home Values in the Area
Average Home Value in this Area
Purchase History
| Date | Buyer | Sale Price | Title Company |
|---|---|---|---|
| Obryan Jason Eric | $110,000 | Lakeside Title & Escrow | |
| Hud | -- | None Available | |
| Abn Amro Mortgage Group Inc | $90,000 | None Available | |
| Baker | $21,300 | -- | |
| -- | $50,000 | -- |
Source: Public Records
Mortgage History
| Date | Status | Borrower | Loan Amount |
|---|---|---|---|
| Open | Obryan Jason Eric | $113,715 |
Source: Public Records
Tax History
| Year | Tax Paid | Tax Assessment Tax Assessment Total Assessment is a certain percentage of the fair market value that is determined by local assessors to be the total taxable value of land and additions on the property. | Land | Improvement |
|---|---|---|---|---|
| 2025 | $2,762 | $67,430 | $17,850 | $49,580 |
| 2024 | $2,762 | $67,430 | $17,850 | $49,580 |
| 2023 | $2,268 | $49,283 | $11,151 | $38,132 |
| 2022 | $2,179 | $49,284 | $11,151 | $38,133 |
| 2021 | $2,104 | $49,284 | $11,151 | $38,133 |
| 2020 | $1,894 | $41,766 | $9,450 | $32,316 |
| 2019 | $1,919 | $41,766 | $9,450 | $32,316 |
| 2018 | $1,911 | $41,766 | $9,450 | $32,316 |
| 2017 | $1,940 | $35,819 | $8,250 | $27,570 |
| 2016 | $1,551 | $35,819 | $8,250 | $27,570 |
| 2015 | $1,554 | $35,819 | $8,250 | $27,570 |
| 2014 | $1,524 | $34,780 | $8,010 | $26,770 |
| 2013 | $1,507 | $45,600 | $10,500 | $35,100 |
Source: Public Records
Map
Nearby Homes
- 120 Cousins Dr
- 7461 Skylark Cir
- 175 Nikki Ct
- 163 Wolf Creek Ct
- 533 Clay St
- 571 Elm Dr
- 90 Timber Creek Dr
- 1223 Waterbury Dr
- 1215 Waterbury Dr
- 1221 Waterbury Dr
- 7958 Dubois Rd
- 121 Mound Builder Place
- 8782 Alyce St
- 1095 Marty Lee Ln
- 7548 Timber Valley Dr
- 7368 Timber Wolf Dr
- 730 Park Ave
- 712 Abney Ln
- 7286 Timber Wolf Dr
- 0 Farmington Rd Unit 1775475
- 7526 Finch Ct
- 7538 Finch Ct
- 7502 Finch Ct
- 7527 Finch Ct
- 7527 Red Robin St
- 8904 Meadowlark Dr
- 7547 Red Robin St
- 7511 Red Robin St
- 7519 Finch Ct
- 8884 Meadowlark Dr
- 8922 Meadowlark Dr
- 7488 Finch Ct
- 7501 Finch Ct
- 7491 Red Robin St
- 8936 Meadowlark Dr
- 7481 Finch Ct
- 8850 Meadowlark Dr
- 7479 Red Robin St
- 8887 Oriole Dr
- 8954 Meadowlark Dr