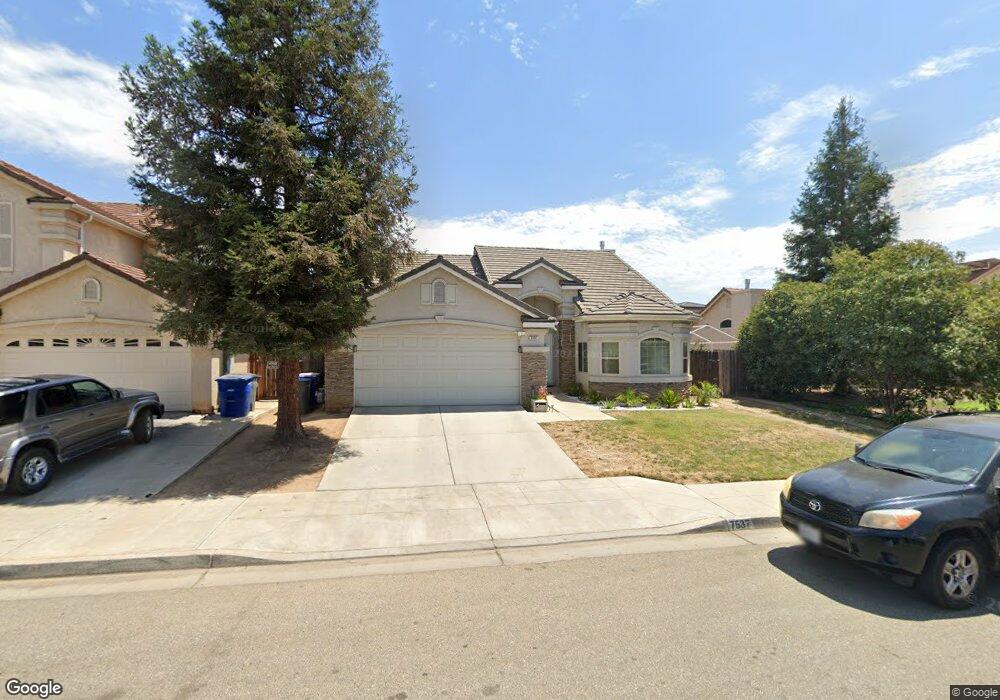
7537 N Paula Ave Fresno, CA 93720
Woodward Park NeighborhoodEstimated Value: $462,019 - $493,000
3
Beds
2
Baths
1,613
Sq Ft
$296/Sq Ft
Est. Value
About This Home
This home is located at 7537 N Paula Ave, Fresno, CA 93720 and is currently estimated at $477,505, approximately $296 per square foot. 7537 N Paula Ave is a home located in Fresno County with nearby schools including Mountain View Elementary School, Granite Ridge Intermediate School, and Clovis North High School.
Ownership History
Date
Name
Owned For
Owner Type
Purchase Details
Closed on
May 31, 2011
Sold by
Asparuhov Stefan A
Bought by
Stefan Asenov Asparuhov Revocable Living and Asparuhov Stefan Asenov
Current Estimated Value
Purchase Details
Closed on
Jun 23, 2008
Sold by
Asparuhov Audrey J
Bought by
Asparuhov Stefan A
Home Financials for this Owner
Home Financials are based on the most recent Mortgage that was taken out on this home.
Original Mortgage
$216,000
Outstanding Balance
$140,017
Interest Rate
6.25%
Mortgage Type
Purchase Money Mortgage
Estimated Equity
$337,488
Purchase Details
Closed on
Sep 6, 2005
Sold by
Bh 5067 Lp
Bought by
Arcemont Gary Joseph
Home Financials for this Owner
Home Financials are based on the most recent Mortgage that was taken out on this home.
Original Mortgage
$246,360
Interest Rate
5.81%
Mortgage Type
New Conventional
Create a Home Valuation Report for This Property
The Home Valuation Report is an in-depth analysis detailing your home's value as well as a comparison with similar homes in the area
Home Values in the Area
Average Home Value in this Area
Purchase History
| Date | Buyer | Sale Price | Title Company |
|---|---|---|---|
| Stefan Asenov Asparuhov Revocable Living | -- | None Available | |
| Asparuhov Stefan A | -- | Fidelity National Title Co | |
| Asparuhov Stefan A | $240,000 | Fidelity National Title Co | |
| Arcemont Gary Joseph | $308,000 | Chicago Title Company |
Source: Public Records
Mortgage History
| Date | Status | Borrower | Loan Amount |
|---|---|---|---|
| Open | Asparuhov Stefan A | $216,000 | |
| Previous Owner | Arcemont Gary Joseph | $246,360 |
Source: Public Records
Tax History Compared to Growth
Tax History
| Year | Tax Paid | Tax Assessment Tax Assessment Total Assessment is a certain percentage of the fair market value that is determined by local assessors to be the total taxable value of land and additions on the property. | Land | Improvement |
|---|---|---|---|---|
| 2025 | $3,804 | $309,054 | $115,893 | $193,161 |
| 2023 | $3,729 | $297,055 | $111,394 | $185,661 |
| 2022 | $3,661 | $291,231 | $109,210 | $182,021 |
| 2021 | $3,539 | $285,521 | $107,069 | $178,452 |
| 2020 | $3,523 | $282,595 | $105,972 | $176,623 |
| 2019 | $3,479 | $277,055 | $103,895 | $173,160 |
| 2018 | $3,403 | $271,623 | $101,858 | $169,765 |
| 2017 | $3,342 | $266,298 | $99,861 | $166,437 |
| 2016 | $3,228 | $261,075 | $97,902 | $163,173 |
| 2015 | $3,071 | $248,300 | $93,100 | $155,200 |
| 2014 | $2,885 | $232,600 | $87,200 | $145,400 |
Source: Public Records
Map
Nearby Homes
- 2658 E Alluvial Ave Unit 220
- 2550 E Jenny Ave
- 7993 N Justin Ave
- 2669 E Sean Ave
- 2672 E Jordan Ave
- 2625 E Sean Ave
- 503 W Athens Ave
- 563 N Chapel Hill Ln
- 2707 E Omaha Ave
- 2906 E Niles Ave
- 522 W Jordan Ave
- 510 W Mahogany Ln
- 450 W Alluvial Ave
- 460 W Balsam Ln
- 2105 E El Paso Ave
- 1257 N Cindy Ave
- 2071 E Cromwell Ave
- 1013 N Karen Ave
- 2825 E Quincy Ave
- 2663 E Spice Way
- 7549 N Paula Ave
- 7525 N Paula Ave
- 7513 N Paula Ave
- 7561 N Paula Ave
- 2792 E Alluvial Ave
- 7571 N Paula Ave
- 7509 N Paula Ave
- 7538 N Paula Ave
- 7526 N Paula Ave
- 7550 N Paula Ave
- 7514 N Paula Ave
- 7562 N Paula Ave
- 7585 N Paula Ave
- 7503 N Paula Ave
- 7574 N Paula Ave
- 7502 N Paula Ave
- 7597 N Paula Ave
- 2820 E Alluvial Ave
- 2816 E Alluvial Ave
- 7586 N Paula Ave