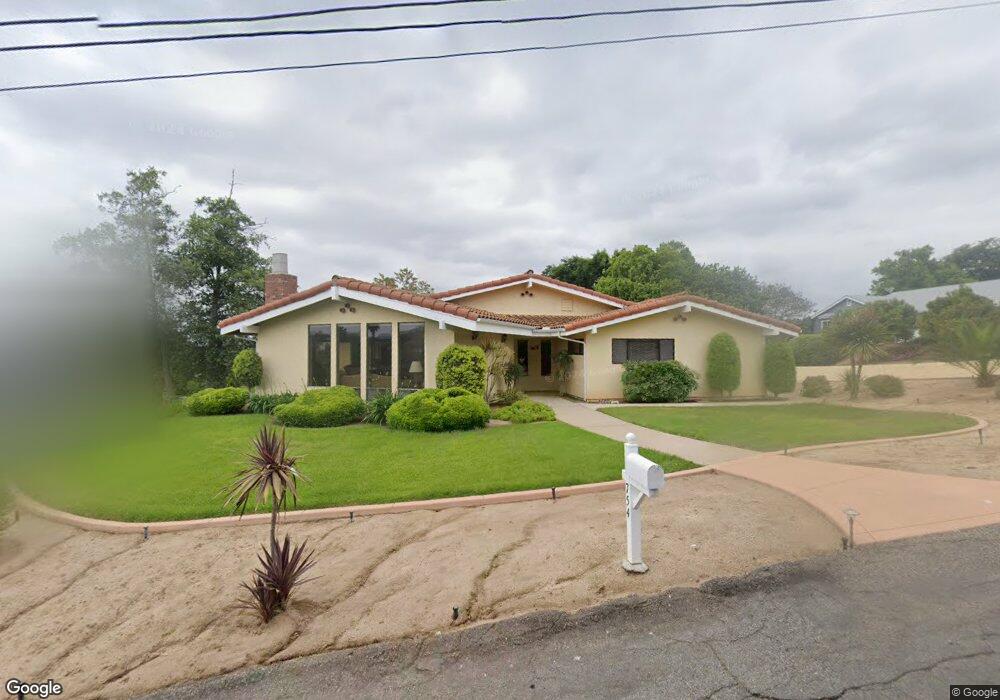
754 Carnation Ln Fallbrook, CA 92028
Estimated Value: $777,695 - $848,000
2
Beds
2
Baths
2,175
Sq Ft
$375/Sq Ft
Est. Value
About This Home
This home is located at 754 Carnation Ln, Fallbrook, CA 92028 and is currently estimated at $816,174, approximately $375 per square foot. 754 Carnation Ln is a home located in San Diego County with nearby schools including La Paloma Elementary School, James E. Potter Intermediate School, and Fallbrook High School.
Ownership History
Date
Name
Owned For
Owner Type
Purchase Details
Closed on
Jan 26, 2005
Sold by
Galati Jerry Michael
Bought by
Ratcliffe Gary B and Ratcliffe Joyce M
Current Estimated Value
Purchase Details
Closed on
Jun 4, 1998
Sold by
Galati Michael R
Bought by
Galati Michael R
Purchase Details
Closed on
Jan 29, 1997
Sold by
Baird James J & Larae Family Trust
Bought by
Galati Michael R and Galati Edith A
Home Financials for this Owner
Home Financials are based on the most recent Mortgage that was taken out on this home.
Original Mortgage
$104,000
Interest Rate
7.56%
Purchase Details
Closed on
Oct 19, 1995
Sold by
Baird James J and Baird La Rae
Bought by
Baird James Johnathan and Baird La Rae
Purchase Details
Closed on
Nov 16, 1992
Create a Home Valuation Report for This Property
The Home Valuation Report is an in-depth analysis detailing your home's value as well as a comparison with similar homes in the area
Home Values in the Area
Average Home Value in this Area
Purchase History
| Date | Buyer | Sale Price | Title Company |
|---|---|---|---|
| Ratcliffe Gary B | $565,000 | Multiple | |
| Galati Michael R | -- | -- | |
| Galati Michael R | $210,000 | Fidelity National Title | |
| Baird James Johnathan | -- | -- | |
| -- | $215,000 | -- |
Source: Public Records
Mortgage History
| Date | Status | Borrower | Loan Amount |
|---|---|---|---|
| Previous Owner | Galati Michael R | $104,000 |
Source: Public Records
Tax History
| Year | Tax Paid | Tax Assessment Tax Assessment Total Assessment is a certain percentage of the fair market value that is determined by local assessors to be the total taxable value of land and additions on the property. | Land | Improvement |
|---|---|---|---|---|
| 2025 | $1,499 | $147,621 | $40,174 | $107,447 |
| 2024 | $1,499 | $144,728 | $39,387 | $105,341 |
| 2023 | $1,462 | $141,891 | $38,615 | $103,276 |
| 2022 | $1,461 | $139,109 | $37,858 | $101,251 |
| 2021 | $1,411 | $136,382 | $37,116 | $99,266 |
| 2020 | $1,421 | $134,985 | $36,736 | $98,249 |
| 2019 | $1,392 | $132,339 | $36,016 | $96,323 |
| 2018 | $1,370 | $129,745 | $35,310 | $94,435 |
| 2017 | $1,341 | $127,202 | $34,618 | $92,584 |
| 2016 | $1,305 | $124,709 | $33,940 | $90,769 |
| 2015 | $1,284 | $122,837 | $33,431 | $89,406 |
| 2014 | $1,259 | $120,432 | $32,777 | $87,655 |
Source: Public Records
Map
Nearby Homes
- 1024 Kiel Rd
- 1003 Via Unidos
- 206 Via Oro Verde
- 956 Woodcreek Rd
- 903 Crescent Bend
- 535 Shady Glen Dr
- 508 Village View Place
- 832 Magarian Rd
- 1304 Farrand Rd
- 1168 N Crescent Ridge Rd
- 0 Laurine Ln
- 1217 Juliette Place
- 929 Pepper Tree Ln
- 741 Rossiter Ln
- 522 S Pico Ave
- 502 E Elder St
- 1027 Pepper Tree Ln
- 1265 E Fallbrook St
- 431 Debby St
- 445 Poets Square
- 766 Carnation Ln
- 748 Carnation Ln
- 776 Carnation Ln
- 776 Pizzo Ln
- 790 Pizzo Ln
- 732 Carnation Ln
- 753 Carnation Ln
- 743 Carnation Ln
- 758 Pizzo Ln
- 814 Pizzo Ln
- 737 Carnation Ln
- 763 Carnation Ln
- 788 Carnation Ln
- 635 Golden Rd
- 734 Pizzo Ln
- 720 Carnation Ln
- 846 Pizzo Ln
- 729 Carnation Ln
- 625 Golden Rd
- 721 Pizzo Ln
Your Personal Tour Guide
Ask me questions while you tour the home.