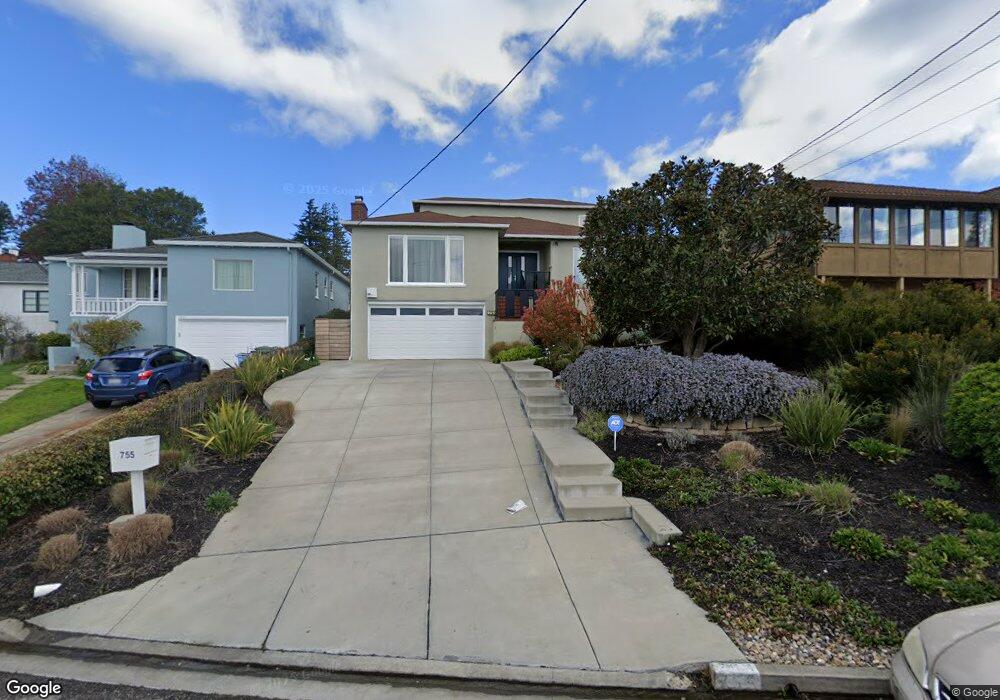
755 Grizzly Peak Blvd Berkeley, CA 94708
Berkeley Hills NeighborhoodEstimated Value: $1,757,000 - $1,959,000
4
Beds
3
Baths
2,297
Sq Ft
$825/Sq Ft
Est. Value
About This Home
This home is located at 755 Grizzly Peak Blvd, Berkeley, CA 94708 and is currently estimated at $1,895,552, approximately $825 per square foot. 755 Grizzly Peak Blvd is a home located in Alameda County with nearby schools including Cragmont Elementary School, Berkeley Arts Magnet at Whittier School, and Washington Elementary School.
Ownership History
Date
Name
Owned For
Owner Type
Purchase Details
Closed on
Jul 12, 2018
Sold by
Jeon Yong M and Lee Jaime H
Bought by
Prabhakar Pavitra
Current Estimated Value
Home Financials for this Owner
Home Financials are based on the most recent Mortgage that was taken out on this home.
Original Mortgage
$450,000
Outstanding Balance
$389,992
Interest Rate
4.5%
Mortgage Type
New Conventional
Estimated Equity
$1,505,560
Purchase Details
Closed on
Jul 27, 2006
Sold by
Benson Daniel C and Yamasaki Sally R
Bought by
Jeon Yong M and Lee Jaime H
Home Financials for this Owner
Home Financials are based on the most recent Mortgage that was taken out on this home.
Original Mortgage
$776,000
Interest Rate
6.76%
Mortgage Type
Purchase Money Mortgage
Purchase Details
Closed on
Jul 16, 2003
Sold by
Rathjens Jeanne Werner and The Jeanne W Rathjens Revocabl
Bought by
Benson Daniel C and Yamasaki Sally R
Home Financials for this Owner
Home Financials are based on the most recent Mortgage that was taken out on this home.
Original Mortgage
$591,200
Interest Rate
3%
Mortgage Type
Purchase Money Mortgage
Create a Home Valuation Report for This Property
The Home Valuation Report is an in-depth analysis detailing your home's value as well as a comparison with similar homes in the area
Home Values in the Area
Average Home Value in this Area
Purchase History
| Date | Buyer | Sale Price | Title Company |
|---|---|---|---|
| Prabhakar Pavitra | $1,600,000 | First American Title Company | |
| Jeon Yong M | $970,000 | Chicago Title Co | |
| Benson Daniel C | $739,000 | Placer Title Company |
Source: Public Records
Mortgage History
| Date | Status | Borrower | Loan Amount |
|---|---|---|---|
| Open | Prabhakar Pavitra | $450,000 | |
| Previous Owner | Jeon Yong M | $776,000 | |
| Previous Owner | Benson Daniel C | $591,200 | |
| Closed | Benson Daniel C | $73,900 |
Source: Public Records
Tax History
| Year | Tax Paid | Tax Assessment Tax Assessment Total Assessment is a certain percentage of the fair market value that is determined by local assessors to be the total taxable value of land and additions on the property. | Land | Improvement |
|---|---|---|---|---|
| 2025 | $25,453 | $1,777,800 | $535,440 | $1,249,360 |
| 2024 | $25,453 | $1,742,807 | $524,942 | $1,224,865 |
| 2023 | $24,943 | $1,715,503 | $514,651 | $1,200,852 |
| 2022 | $24,537 | $1,674,871 | $504,561 | $1,177,310 |
| 2021 | $24,626 | $1,641,895 | $494,668 | $1,154,227 |
| 2020 | $23,392 | $1,632,000 | $489,600 | $1,142,400 |
| 2019 | $22,573 | $1,600,000 | $480,000 | $1,120,000 |
| 2018 | $17,191 | $1,152,051 | $342,635 | $809,416 |
| 2017 | $16,611 | $1,129,468 | $335,918 | $793,550 |
| 2016 | $16,085 | $1,107,326 | $329,333 | $777,993 |
| 2015 | $15,872 | $1,090,703 | $324,389 | $766,314 |
| 2014 | $15,713 | $1,069,343 | $318,036 | $751,307 |
Source: Public Records
Map
Nearby Homes
- 731 Grizzly Peak Blvd
- 890 Keeler Ave
- 935 Grizzly Peak Blvd
- 982 Grizzly Peak Blvd
- 614 Cragmont Ave
- 758 Spruce St
- 1024 Grizzly Peak Blvd
- 1024 Miller Ave
- 962 Regal Rd
- 770 Santa Barbara Rd
- 410 Grizzly Peak Blvd
- 813 San Diego Rd
- 1040 Park Hills Rd
- 826 Indian Rock Ave
- 765 San Diego Rd
- 1100 Miller Ave
- 1106 Cragmont Ave
- 483 Boynton Ave
- 1119 Miller Ave
- 589 San Luis Rd
- 747 Grizzly Peak Blvd
- 759 Grizzly Peak Blvd
- 765 Grizzly Peak Blvd
- 745 Grizzly Peak Blvd
- 756 Creston Rd
- 762 Creston Rd
- 750 Creston Rd
- 766 Creston Rd
- 771 Grizzly Peak Blvd
- 739 Grizzly Peak Blvd
- 744 Creston Rd
- 770 Creston Rd
- 744 Grizzly Peak Blvd
- 752 Grizzly Peak Blvd
- 736 Grizzly Peak Blvd
- 760 Grizzly Peak Blvd
- 777 Grizzly Peak Blvd
- 762 Grizzly Peak Blvd
- 735 Grizzly Peak Blvd
- 768 Grizzly Peak Blvd
Your Personal Tour Guide
Ask me questions while you tour the home.