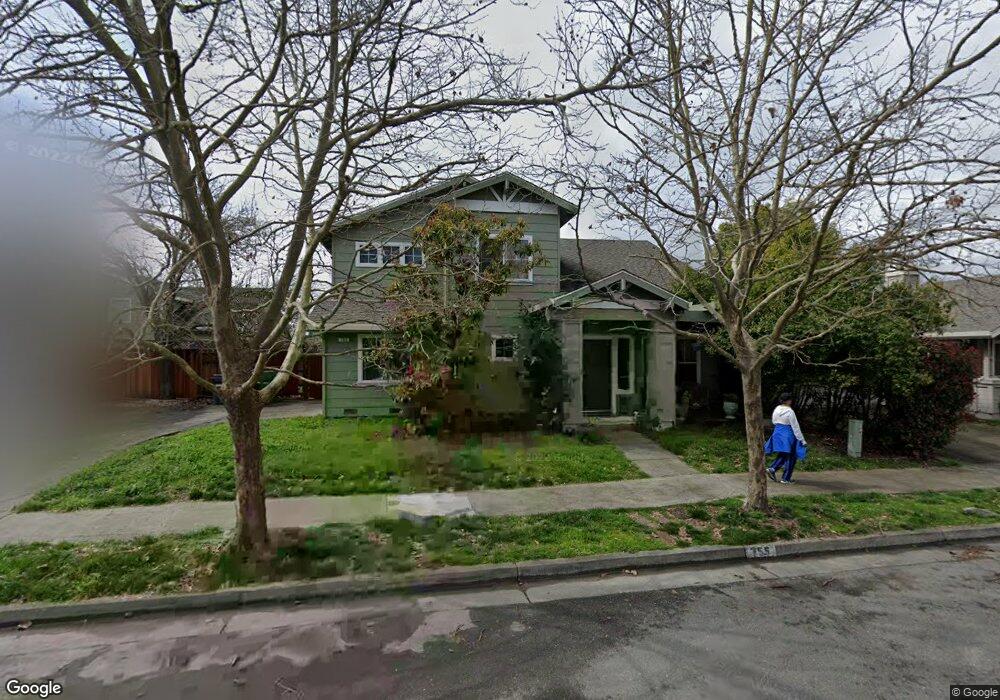
755 Riesling Rd Petaluma, CA 94954
College Heights NeighborhoodEstimated Value: $739,118 - $968,000
3
Beds
3
Baths
1,591
Sq Ft
$517/Sq Ft
Est. Value
About This Home
This home is located at 755 Riesling Rd, Petaluma, CA 94954 and is currently estimated at $823,280, approximately $517 per square foot. 755 Riesling Rd is a home located in Sonoma County with nearby schools including Corona Creek Elementary School, Kenilworth Junior High School, and Casa Grande High School.
Ownership History
Date
Name
Owned For
Owner Type
Purchase Details
Closed on
Dec 21, 1998
Sold by
Fox Robert Dewitt and Fox Julie K
Bought by
Fox Robert Dewitt and Fox Julie K
Current Estimated Value
Home Financials for this Owner
Home Financials are based on the most recent Mortgage that was taken out on this home.
Original Mortgage
$157,700
Outstanding Balance
$35,945
Interest Rate
6.82%
Estimated Equity
$787,335
Purchase Details
Closed on
May 26, 1995
Sold by
Petaluma Venture Partners
Bought by
Fox Robert Dewitt and Denny Julie K
Home Financials for this Owner
Home Financials are based on the most recent Mortgage that was taken out on this home.
Original Mortgage
$169,150
Interest Rate
8.32%
Mortgage Type
Assumption
Purchase Details
Closed on
May 24, 1995
Sold by
Fox Virginia
Bought by
Fox Alexander
Home Financials for this Owner
Home Financials are based on the most recent Mortgage that was taken out on this home.
Original Mortgage
$169,150
Interest Rate
8.32%
Mortgage Type
Assumption
Create a Home Valuation Report for This Property
The Home Valuation Report is an in-depth analysis detailing your home's value as well as a comparison with similar homes in the area
Home Values in the Area
Average Home Value in this Area
Purchase History
| Date | Buyer | Sale Price | Title Company |
|---|---|---|---|
| Fox Robert Dewitt | -- | Fidelity National Title | |
| Fox Robert Dewitt | $199,000 | North Bay Title Co | |
| Fox Alexander | -- | North Bay Title Company |
Source: Public Records
Mortgage History
| Date | Status | Borrower | Loan Amount |
|---|---|---|---|
| Open | Fox Robert Dewitt | $157,700 | |
| Closed | Fox Robert Dewitt | $169,150 |
Source: Public Records
Tax History
| Year | Tax Paid | Tax Assessment Tax Assessment Total Assessment is a certain percentage of the fair market value that is determined by local assessors to be the total taxable value of land and additions on the property. | Land | Improvement |
|---|---|---|---|---|
| 2025 | $6,207 | $330,222 | $141,402 | $188,820 |
| 2024 | $6,207 | $323,748 | $138,630 | $185,118 |
| 2023 | $6,207 | $317,401 | $135,912 | $181,489 |
| 2022 | $6,146 | $311,179 | $133,248 | $177,931 |
| 2021 | $6,020 | $305,079 | $130,636 | $174,443 |
| 2020 | $3,650 | $301,952 | $129,297 | $172,655 |
| 2019 | $3,617 | $296,032 | $126,762 | $169,270 |
| 2018 | $3,645 | $290,228 | $124,277 | $165,951 |
| 2017 | $3,592 | $284,539 | $121,841 | $162,698 |
| 2016 | $3,487 | $278,960 | $119,452 | $159,508 |
| 2015 | $3,472 | $274,771 | $117,658 | $157,113 |
| 2014 | $3,444 | $269,390 | $115,354 | $154,036 |
Source: Public Records
Map
Nearby Homes
- 14 Sheffield Place
- 1757 Burgundy Ct
- 821 Rolling Hill Dr
- 1997 Rainier Cir
- 125 Saratoga Ct
- 1717 Brompton St
- 97 Candlewood Dr
- 148 Oakwood Dr
- 571 Birchwood Dr
- 75 Candlewood Dr
- 1414 Mauro Pietro Dr Unit 301
- 717 N Mcdowell Blvd Unit 511
- 570 Sonoma Dr
- 7 Michael Dr
- 93 W Napa Dr
- 57 W Napa Dr
- 1811 Maiden Ln
- 240 Park Place Dr
- 1642 Lauren Dr
- 1252 Petaluma Blvd N
- 751 Riesling Rd
- 710 Mount Vernon Way
- 759 Riesling Rd
- 706 Mount Vernon Way
- 714 Mount Vernon Way
- 747 Riesling Rd
- 702 Mount Vernon Way
- 752 Riesling Rd
- 748 Riesling Rd
- 709 Mount Vernon Way
- 1870 Lexington St
- 763 Riesling Rd
- 713 Mount Vernon Way
- 743 Riesling Rd
- 726 Mount Vernon Way
- 14 Berkshire Place
- 764 Riesling Rd
- 744 Riesling Rd
- 13 Berkshire Place
Your Personal Tour Guide
Ask me questions while you tour the home.