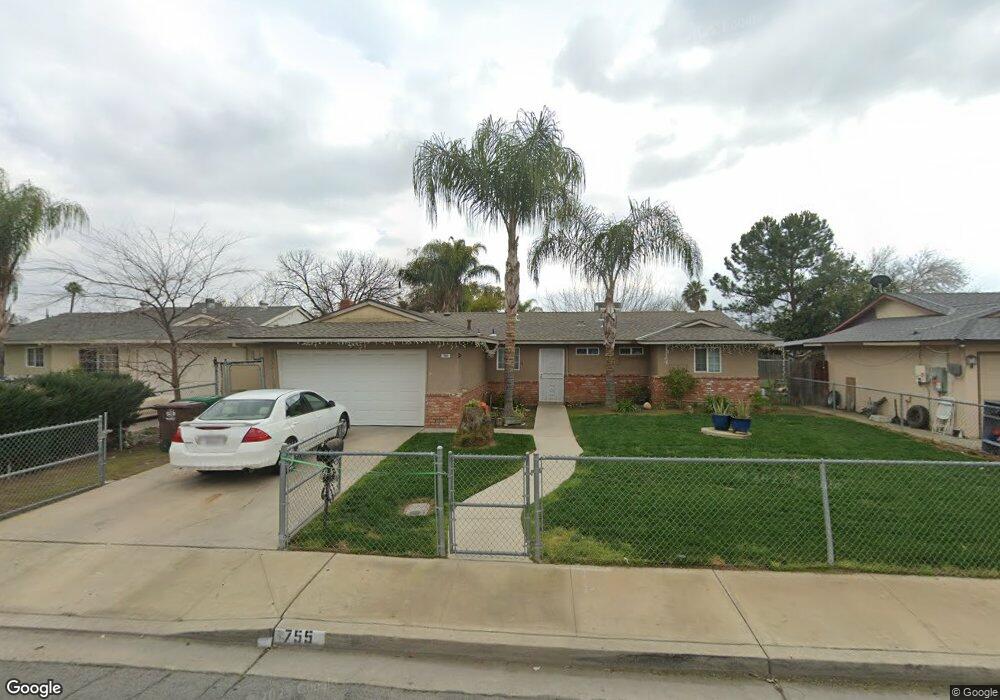
755 Simone Way Sanger, CA 93657
Estimated Value: $251,213 - $316,000
2
Beds
2
Baths
970
Sq Ft
$285/Sq Ft
Est. Value
About This Home
This home is located at 755 Simone Way, Sanger, CA 93657 and is currently estimated at $276,071, approximately $284 per square foot. 755 Simone Way is a home located in Fresno County with nearby schools including Jefferson Elementary School, Washington Academic Middle School, and Sanger High School.
Ownership History
Date
Name
Owned For
Owner Type
Purchase Details
Closed on
Oct 17, 2019
Sold by
Navarro Mia
Bought by
Moreno Maricela Valenzuela
Current Estimated Value
Purchase Details
Closed on
Dec 14, 2017
Sold by
Navarro Mia
Bought by
Amaro Gregory and Navarro Mia
Purchase Details
Closed on
Jun 23, 2017
Sold by
Moreno Maricela Valensuela
Bought by
Navarro Mia
Purchase Details
Closed on
Aug 2, 2006
Sold by
Navarro Mia
Bought by
Moreno Maricela Valenzuela and Navarro Mia
Purchase Details
Closed on
May 23, 2006
Sold by
Moreno Maricela Valenzuela
Bought by
Navarro Mia
Home Financials for this Owner
Home Financials are based on the most recent Mortgage that was taken out on this home.
Original Mortgage
$97,000
Interest Rate
6.69%
Mortgage Type
Purchase Money Mortgage
Create a Home Valuation Report for This Property
The Home Valuation Report is an in-depth analysis detailing your home's value as well as a comparison with similar homes in the area
Home Values in the Area
Average Home Value in this Area
Purchase History
| Date | Buyer | Sale Price | Title Company |
|---|---|---|---|
| Moreno Maricela Valenzuela | -- | None Available | |
| Navarro Mia | -- | None Available | |
| Amaro Gregory | -- | None Available | |
| Navarro Mia | -- | None Available | |
| Moreno Maricela Valenzuela | -- | Financial Title Company | |
| Navarro Mia | -- | Financial Title Company | |
| Moreno Maricela Valenzuela | -- | Accommodation |
Source: Public Records
Mortgage History
| Date | Status | Borrower | Loan Amount |
|---|---|---|---|
| Previous Owner | Navarro Mia | $97,000 |
Source: Public Records
Tax History
| Year | Tax Paid | Tax Assessment Tax Assessment Total Assessment is a certain percentage of the fair market value that is determined by local assessors to be the total taxable value of land and additions on the property. | Land | Improvement |
|---|---|---|---|---|
| 2025 | $1,303 | $101,290 | $30,002 | $71,288 |
| 2023 | $1,221 | $97,359 | $28,838 | $68,521 |
| 2022 | $1,203 | $95,451 | $28,273 | $67,178 |
| 2021 | $1,194 | $93,580 | $27,719 | $65,861 |
| 2020 | $1,159 | $92,621 | $27,435 | $65,186 |
| 2019 | $1,136 | $90,806 | $26,898 | $63,908 |
| 2018 | $1,090 | $89,026 | $26,371 | $62,655 |
| 2017 | $1,071 | $87,281 | $25,854 | $61,427 |
| 2016 | $1,008 | $85,571 | $25,348 | $60,223 |
| 2015 | $1,016 | $84,287 | $24,968 | $59,319 |
| 2014 | $1,003 | $82,637 | $24,479 | $58,158 |
Source: Public Records
Map
Nearby Homes
Your Personal Tour Guide
Ask me questions while you tour the home.