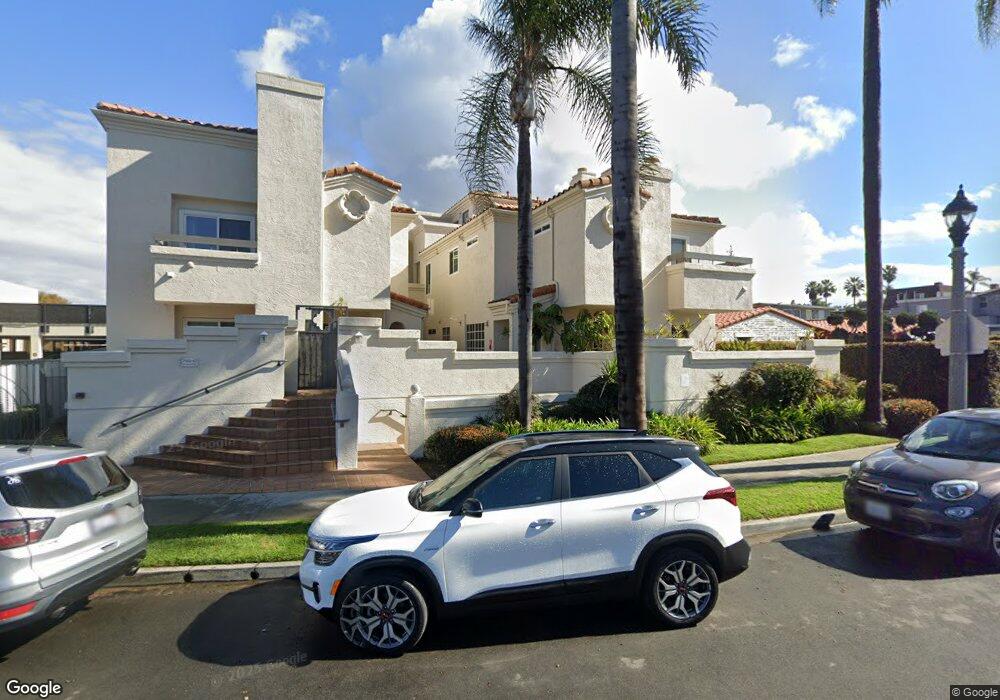
7553 1/2 La Jolla Blvd Unit 2 La Jolla, CA 92037
The Village NeighborhoodEstimated Value: $1,269,000 - $1,609,000
3
Beds
2
Baths
1,053
Sq Ft
$1,371/Sq Ft
Est. Value
About This Home
This home is located at 7553 1/2 La Jolla Blvd Unit 2, La Jolla, CA 92037 and is currently estimated at $1,443,199, approximately $1,370 per square foot. 7553 1/2 La Jolla Blvd Unit 2 is a home located in San Diego County with nearby schools including La Jolla Elementary School, Muirlands Middle School, and La Jolla High School.
Ownership History
Date
Name
Owned For
Owner Type
Purchase Details
Closed on
Jul 23, 2019
Sold by
Manassarians Henrik and Tabora Lesly Giselle Aguilar
Bought by
The Bishop S School Inc
Current Estimated Value
Purchase Details
Closed on
Jul 1, 2013
Sold by
Owens Kathleen D
Bought by
Manassarians Henrik and Tabora Lesly Giselle Aguilar
Home Financials for this Owner
Home Financials are based on the most recent Mortgage that was taken out on this home.
Original Mortgage
$453,600
Interest Rate
4.28%
Mortgage Type
New Conventional
Purchase Details
Closed on
Mar 11, 1996
Sold by
Emc Mortgage Corp
Bought by
Davey Thomas Roland and Davey Patricia Riebeth
Purchase Details
Closed on
Jul 31, 1995
Sold by
Great Western Bank
Bought by
Emc Mtg Corp
Purchase Details
Closed on
Jun 29, 1995
Sold by
Siller Eduardo Saucedo
Bought by
Great Western Bank
Create a Home Valuation Report for This Property
The Home Valuation Report is an in-depth analysis detailing your home's value as well as a comparison with similar homes in the area
Home Values in the Area
Average Home Value in this Area
Purchase History
| Date | Buyer | Sale Price | Title Company |
|---|---|---|---|
| The Bishop S School Inc | $830,000 | Wfg National Title Company | |
| Manassarians Henrik | $648,000 | Lawyers Title | |
| Davey Thomas Roland | $182,000 | Chicago Title Company | |
| Davey Thomas Roland | $182,000 | Chicago Title Co | |
| Emc Mtg Corp | $160,000 | Chicago Title Co | |
| Great Western Bank | $155,339 | Orange Coast Title |
Source: Public Records
Mortgage History
| Date | Status | Borrower | Loan Amount |
|---|---|---|---|
| Previous Owner | Manassarians Henrik | $453,600 |
Source: Public Records
Tax History Compared to Growth
Tax History
| Year | Tax Paid | Tax Assessment Tax Assessment Total Assessment is a certain percentage of the fair market value that is determined by local assessors to be the total taxable value of land and additions on the property. | Land | Improvement |
|---|---|---|---|---|
| 2025 | $11,060 | $907,720 | $498,753 | $408,967 |
| 2024 | $11,060 | $889,923 | $488,974 | $400,949 |
| 2023 | $10,816 | $872,475 | $479,387 | $393,088 |
| 2022 | $10,528 | $855,369 | $469,988 | $385,381 |
| 2021 | $10,454 | $838,598 | $460,773 | $377,825 |
| 2020 | $10,328 | $830,000 | $456,049 | $373,951 |
| 2019 | $8,894 | $712,093 | $391,264 | $320,829 |
| 2018 | $8,234 | $698,132 | $383,593 | $314,539 |
| 2017 | $8,125 | $684,444 | $376,072 | $308,372 |
| 2016 | $7,911 | $671,025 | $368,699 | $302,326 |
| 2015 | $7,795 | $660,946 | $363,161 | $297,785 |
| 2014 | $7,672 | $648,000 | $356,048 | $291,952 |
Source: Public Records
Map
Nearby Homes
- 7520 Draper Ave Unit 3
- 302 Prospect St Unit 7
- 302 Prospect St Unit 6
- 357 Coast Blvd S
- 265 Coast Blvd Unit 9
- 229 Coast Blvd Unit U1
- 726 Silver St
- 708 Silver St
- 718 Silver St
- 100 Coast Blvd Unit 101
- 7560 Eads Ave Unit 12
- 202 Coast Blvd Unit 4
- 220 Coast Blvd Unit 2M
- 7635 Draper Ave Unit LU4
- 7601 Eads Ave
- 7757 Eads Ave Unit B7
- 7372 Fay Ave
- 609 Genter St
- 7376 Fay Ave
- 716 Glenview Ln
- 7553 La Jolla Blvd Unit 1/2
- 7553 La Jolla Blvd 1 2 Unit 1
- 7555 La Jolla Blvd
- 7553 La Jolla Blvd
- 7553 1/2 La Jolla Blvd Unit 1
- 7555 1/2 La Jolla Blvd
- 7557 La Jolla Blvd
- 7565 La Jolla Blvd
- 7559 La Jolla Blvd Unit 6
- 7567 La Jolla Blvd
- 7563 La Jolla Blvd
- 7561 La Jolla Blvd
- 7541 La Jolla Blvd Unit 51
- 7535 La Jolla Blvd
- 7535 La Jolla Blvd Unit 7&8
- 7602 La Jolla Blvd
- 7509 La Jolla Blvd
- 7570 La Jolla Blvd Unit 17,18
- 7570 La Jolla Blvd Unit 350-411-16-00
- 7570 La Jolla Blvd Unit 90