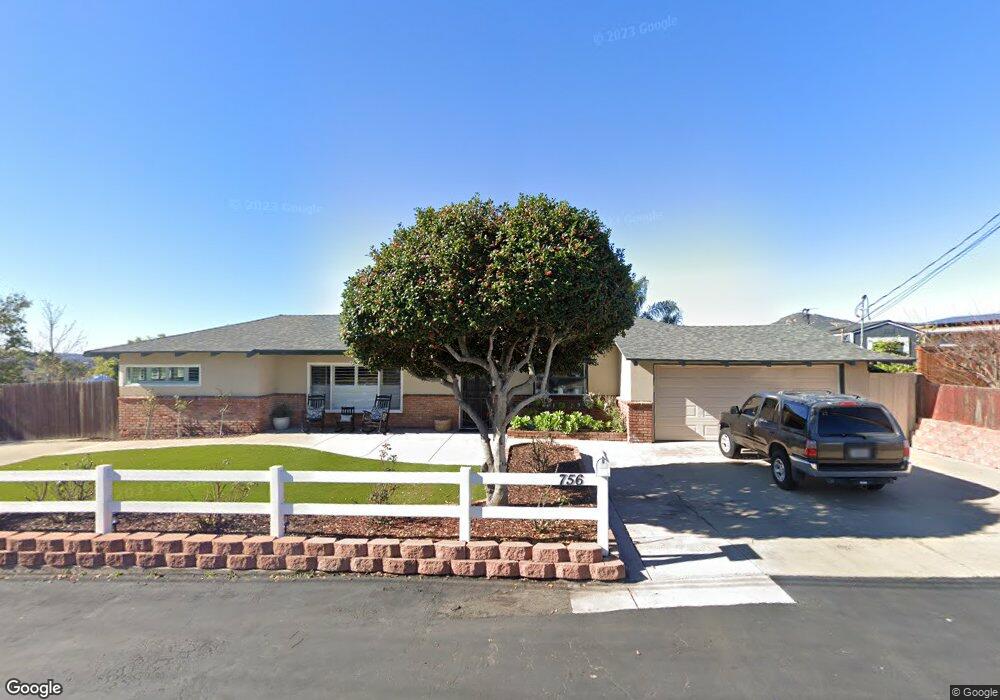
756 Sharon Way El Cajon, CA 92020
Fletcher Hills NeighborhoodEstimated Value: $1,132,000 - $1,415,000
3
Beds
4
Baths
3,019
Sq Ft
$404/Sq Ft
Est. Value
About This Home
This home is located at 756 Sharon Way, El Cajon, CA 92020 and is currently estimated at $1,219,368, approximately $403 per square foot. 756 Sharon Way is a home located in San Diego County with nearby schools including Fletcher Hills Elementary School, Parkway Academy, and West Hills High School.
Ownership History
Date
Name
Owned For
Owner Type
Purchase Details
Closed on
Sep 3, 2021
Sold by
Sanchez Joseph and Sanchez Jessica
Bought by
Sanchez Joseph A and Sanchez Jessica
Current Estimated Value
Purchase Details
Closed on
Jun 5, 2012
Sold by
Odell Cheryl M
Bought by
Sanchez Joseph and Sanchez Jessica
Home Financials for this Owner
Home Financials are based on the most recent Mortgage that was taken out on this home.
Original Mortgage
$488,979
Outstanding Balance
$337,924
Interest Rate
3.77%
Mortgage Type
FHA
Estimated Equity
$881,444
Purchase Details
Closed on
Oct 5, 1994
Sold by
Kapferer Hans J
Bought by
Odell Cheryl M
Home Financials for this Owner
Home Financials are based on the most recent Mortgage that was taken out on this home.
Original Mortgage
$240,000
Interest Rate
6.37%
Purchase Details
Closed on
Aug 25, 1993
Sold by
Kapferer Hans J
Bought by
Odell Cheryl M
Home Financials for this Owner
Home Financials are based on the most recent Mortgage that was taken out on this home.
Original Mortgage
$140,000
Interest Rate
7.16%
Purchase Details
Closed on
Mar 4, 1993
Create a Home Valuation Report for This Property
The Home Valuation Report is an in-depth analysis detailing your home's value as well as a comparison with similar homes in the area
Home Values in the Area
Average Home Value in this Area
Purchase History
| Date | Buyer | Sale Price | Title Company |
|---|---|---|---|
| Sanchez Joseph A | -- | None Available | |
| Sanchez Joseph | $498,000 | California Title Company | |
| Odell Cheryl M | -- | American Title Insurance Co | |
| Odell Cheryl M | -- | World Title Company | |
| -- | $215,000 | -- |
Source: Public Records
Mortgage History
| Date | Status | Borrower | Loan Amount |
|---|---|---|---|
| Open | Sanchez Joseph | $488,979 | |
| Previous Owner | Odell Cheryl M | $240,000 | |
| Previous Owner | Odell Cheryl M | $140,000 |
Source: Public Records
Tax History Compared to Growth
Tax History
| Year | Tax Paid | Tax Assessment Tax Assessment Total Assessment is a certain percentage of the fair market value that is determined by local assessors to be the total taxable value of land and additions on the property. | Land | Improvement |
|---|---|---|---|---|
| 2025 | $7,812 | $625,502 | $257,560 | $367,942 |
| 2024 | $7,812 | $613,238 | $252,510 | $360,728 |
| 2023 | $7,587 | $601,214 | $247,559 | $353,655 |
| 2022 | $7,648 | $589,426 | $242,705 | $346,721 |
| 2021 | $7,474 | $577,870 | $237,947 | $339,923 |
| 2020 | $7,045 | $571,946 | $235,508 | $336,438 |
| 2019 | $6,451 | $560,733 | $230,891 | $329,842 |
| 2018 | $6,332 | $549,739 | $226,364 | $323,375 |
| 2017 | $30 | $538,961 | $221,926 | $317,035 |
| 2016 | $6,100 | $528,394 | $217,575 | $310,819 |
| 2015 | $6,058 | $520,458 | $214,307 | $306,151 |
| 2014 | $5,937 | $510,264 | $210,110 | $300,154 |
Source: Public Records
Map
Nearby Homes
- 700 Wakefield Ct
- 1958 Milford Place
- 2213 Chatham St
- 2524 Seattle Dr
- 2394 Dryden Rd
- 2052 Flying Hills Ln
- 282 Garfield Ave
- 0 Hacienda Dr
- 1681 Hillsmont Dr
- 1673 Hillsmont Dr
- 198 Croydon Ln
- 2106 Windmill View Rd
- 731 Dewane Dr
- 1387 Weers St
- 2527 Gibbons St
- 8774 Tommy Dr
- 188 Garden Grove Ln
- 9348 Horton Dr
- 8735 Navajo Rd Unit 8
- 1340 Heron Ave
- 744 Sharon Way
- 794 Sharon Way
- 785 Haverhill Rd
- 777 Haverhill Rd
- 799 Haverhill Rd
- 769 Sharon Way
- 736 Sharon Way
- 765 Haverhill Rd
- 812 Sharon Way
- 741 Sharon Way
- 797 Sharon Way
- 815 Haverhill Rd
- 759 Haverhill Rd
- 739 Sharon Way
- 724 Sharon Way
- 780 Haverhill Rd
- 819 Sharon Way Unit 2
- 788 Haverhill Rd
- 828 Sharon Way
- 766 Haverhill Rd