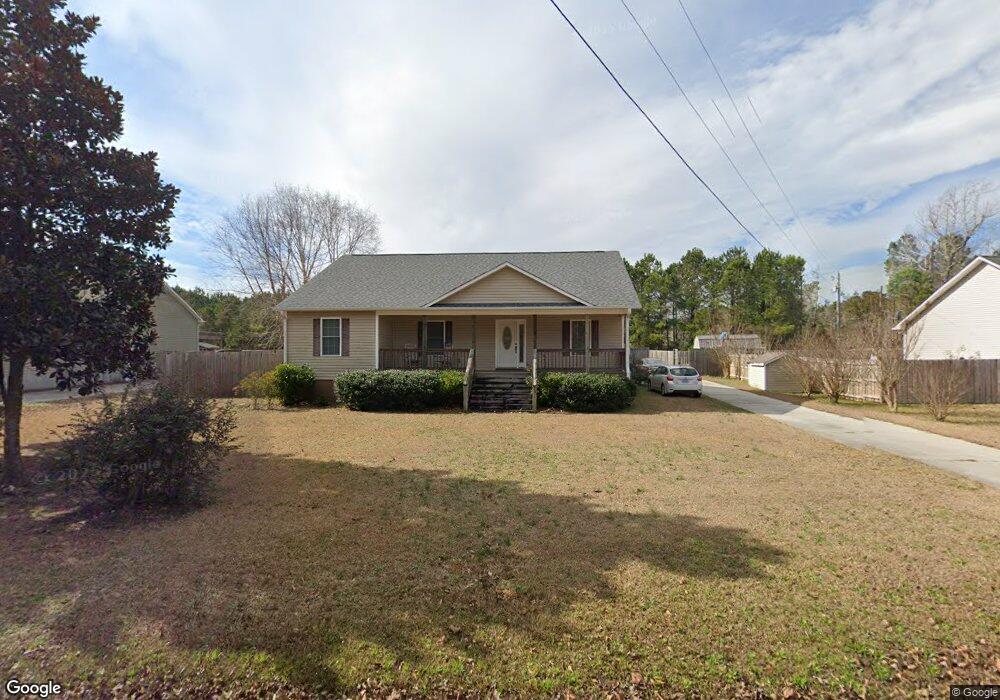
758 Sloop Point Rd Hampstead, NC 28443
Estimated Value: $373,392 - $442,000
3
Beds
2
Baths
1,475
Sq Ft
$277/Sq Ft
Est. Value
About This Home
This home is located at 758 Sloop Point Rd, Hampstead, NC 28443 and is currently estimated at $408,598, approximately $277 per square foot. 758 Sloop Point Rd is a home located in Pender County with nearby schools including North Topsail Elementary School, Topsail Middle School, and Topsail High School.
Ownership History
Date
Name
Owned For
Owner Type
Purchase Details
Closed on
Mar 2, 2011
Sold by
Secretary Of Veterans Affairs
Bought by
Marra Robert Sean
Current Estimated Value
Home Financials for this Owner
Home Financials are based on the most recent Mortgage that was taken out on this home.
Original Mortgage
$155,440
Outstanding Balance
$106,253
Interest Rate
4.99%
Mortgage Type
New Conventional
Estimated Equity
$302,345
Purchase Details
Closed on
Oct 10, 2010
Sold by
Powers Michael and Powers Ithena
Bought by
Secretary Of Veterans Affairs
Purchase Details
Closed on
Jun 27, 2007
Sold by
Hudson Edward Thomas and Hudson Muriel
Bought by
Powers Michael and Powers Ithena
Home Financials for this Owner
Home Financials are based on the most recent Mortgage that was taken out on this home.
Original Mortgage
$210,834
Interest Rate
6.16%
Mortgage Type
New Conventional
Create a Home Valuation Report for This Property
The Home Valuation Report is an in-depth analysis detailing your home's value as well as a comparison with similar homes in the area
Home Values in the Area
Average Home Value in this Area
Purchase History
| Date | Buyer | Sale Price | Title Company |
|---|---|---|---|
| Marra Robert Sean | -- | -- | |
| Secretary Of Veterans Affairs | $166,125 | -- | |
| Powers Michael | $204,000 | -- |
Source: Public Records
Mortgage History
| Date | Status | Borrower | Loan Amount |
|---|---|---|---|
| Open | Marra Robert Sean | $155,440 | |
| Previous Owner | Powers Michael | $210,834 |
Source: Public Records
Tax History
| Year | Tax Paid | Tax Assessment Tax Assessment Total Assessment is a certain percentage of the fair market value that is determined by local assessors to be the total taxable value of land and additions on the property. | Land | Improvement |
|---|---|---|---|---|
| 2025 | $1,950 | $348,056 | $76,950 | $271,106 |
| 2024 | $1,950 | $189,185 | $34,965 | $154,220 |
| 2023 | $1,950 | $189,185 | $34,965 | $154,220 |
| 2022 | $1,685 | $189,185 | $34,965 | $154,220 |
| 2021 | $1,685 | $189,185 | $34,965 | $154,220 |
| 2020 | $1,685 | $189,185 | $34,965 | $154,220 |
| 2019 | $1,685 | $189,185 | $34,965 | $154,220 |
| 2018 | $1,538 | $163,644 | $24,500 | $139,144 |
| 2017 | $1,538 | $163,644 | $24,500 | $139,144 |
| 2016 | $1,521 | $163,644 | $24,500 | $139,144 |
| 2015 | $1,503 | $163,644 | $24,500 | $139,144 |
| 2014 | $1,269 | $163,644 | $24,500 | $139,144 |
| 2013 | -- | $163,644 | $24,500 | $139,144 |
| 2012 | -- | $163,644 | $24,500 | $139,144 |
Source: Public Records
Map
Nearby Homes
- 800 Wildwood Cir
- 808 Wildwood Cir
- 814 Wildwood Cir
- 43 Westminster Way
- 116 Mansfield Ct
- 233 Hampton Ct
- 23 Stonegate Cir
- Lot 9 Bay Harbor Dr
- Lot 46 Crown Pointe Dr
- Lot 50 Crown Pointe Dr
- Lot 49 Crown Pointe Dr
- Lot 48 Crown Pointe Dr
- Lot 42 Crown Pointe Dr
- Lot 45 Crown Pointe Dr
- 858 Wildwood Cir
- 111 Cirrus Ct
- L2 Crystal Ct
- L3 Crystal Ct
- 753 Crown Pointe Dr
- 1320 Sloop Point Rd
- 770 Sloop Point Rd
- 740 Sloop Point Rd
- 794 Sloop Point Rd
- 739 Sloop Point Rd
- 795 Sloop Point Rd
- 795 Sloop Point
- 814 Sloop Point Rd
- 792 Wildwood Cir
- 794 Wildwood Cir
- 817 Sloop Point
- 796 Wildwood Cir
- 850 Sloop Point Rd
- 849 Sloop Point Rd
- 716 Sloop Point Rd
- 716 Sloop Point Rd
- 636 Sloop Point Rd
- 632 Bay Harbor Dr
- 793 Wildwood Cir
- 876 Sloop Point Rd
- 875 Sloop Point Rd
Your Personal Tour Guide
Ask me questions while you tour the home.