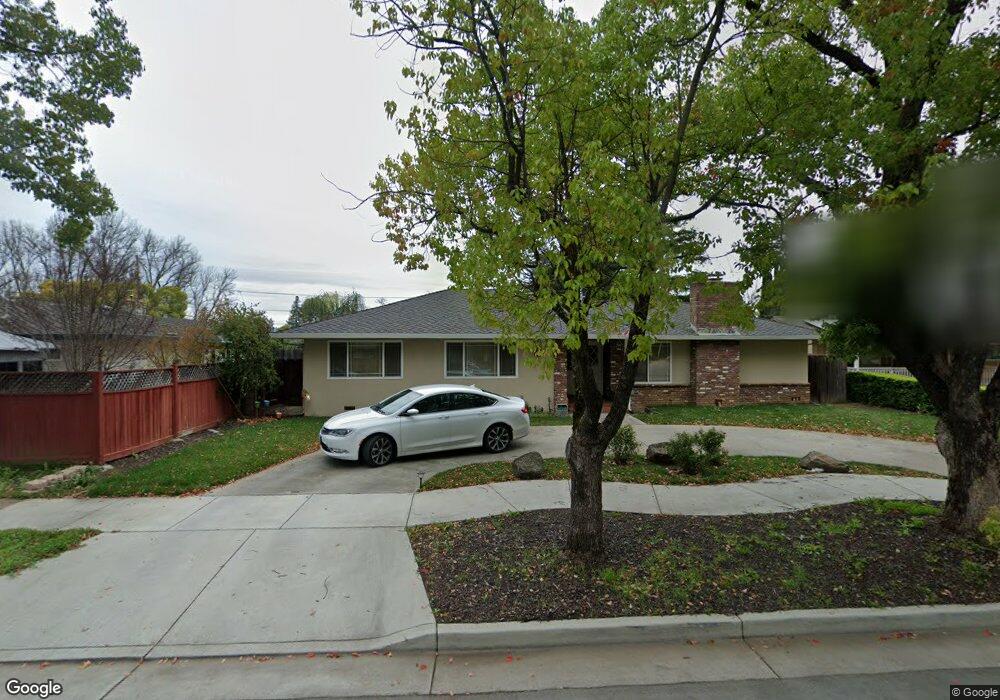
7580 Filice Dr Gilroy, CA 95020
Estimated Value: $765,000 - $968,000
3
Beds
2
Baths
1,686
Sq Ft
$538/Sq Ft
Est. Value
About This Home
This home is located at 7580 Filice Dr, Gilroy, CA 95020 and is currently estimated at $906,931, approximately $537 per square foot. 7580 Filice Dr is a home located in Santa Clara County with nearby schools including El Roble Elementary School, Brownell Middle School, and Solorsano Middle School.
Ownership History
Date
Name
Owned For
Owner Type
Purchase Details
Closed on
May 6, 2013
Sold by
Rossi Alan
Bought by
Chuck Mitchell Donald and Chuck Janet Marie
Current Estimated Value
Purchase Details
Closed on
Mar 10, 1995
Sold by
Chappell Robert P and Rossi Joanne C
Bought by
Rossi Joanne C
Create a Home Valuation Report for This Property
The Home Valuation Report is an in-depth analysis detailing your home's value as well as a comparison with similar homes in the area
Home Values in the Area
Average Home Value in this Area
Purchase History
| Date | Buyer | Sale Price | Title Company |
|---|---|---|---|
| Chuck Mitchell Donald | $325,000 | Chicago Title Company | |
| Rossi Joanne C | -- | -- |
Source: Public Records
Tax History
| Year | Tax Paid | Tax Assessment Tax Assessment Total Assessment is a certain percentage of the fair market value that is determined by local assessors to be the total taxable value of land and additions on the property. | Land | Improvement |
|---|---|---|---|---|
| 2025 | $4,939 | $400,201 | $220,050 | $180,151 |
| 2024 | $4,939 | $392,355 | $215,736 | $176,619 |
| 2023 | $4,910 | $384,662 | $211,506 | $173,156 |
| 2022 | $4,829 | $377,120 | $207,359 | $169,761 |
| 2021 | $4,806 | $369,727 | $203,294 | $166,433 |
| 2020 | $4,753 | $365,937 | $201,210 | $164,727 |
| 2019 | $4,710 | $358,763 | $197,265 | $161,498 |
| 2018 | $4,400 | $351,730 | $193,398 | $158,332 |
| 2017 | $4,491 | $344,834 | $189,606 | $155,228 |
| 2016 | $4,397 | $338,074 | $185,889 | $152,185 |
| 2015 | $4,150 | $332,997 | $183,097 | $149,900 |
| 2014 | $4,124 | $326,475 | $179,511 | $146,964 |
Source: Public Records
Map
Nearby Homes
- 7490 Santa Theresa Dr Unit 10
- 60 Monte Vista Way
- 7460 Miller Ave
- 925 Blake Ct
- 700 Eschenburg Dr
- 7379 Ailes Ct
- 7384 Ailes Ct
- 7821 Santa Theresa Dr
- 7376 Ailes Ct
- 7305 Orchard Dr
- 7360 Ailes Ct
- 7344 Ailes Ct
- 7351 Princevalle St Unit Homesite 18
- 704 Tennyson Dr
- 730 Tennyson Dr
- 6389 Tawhana Ln
- 7681 Hanna St
- 7969 Kipling Cir
- 704 Lexington Place
- 7630 Hanna St
- 7570 Filice Dr
- 840 4th St
- 7560 Filice Dr
- 7581 Miller Ave
- 7571 Miller Ave
- 7591 Miller Ave
- 7581 Filice Dr
- 7561 Miller Ave
- 7591 Filice Dr
- 7571 Filice Dr
- 7550 Filice Dr
- 849 4th St
- 7561 Filice Dr
- 7551 Miller Ave
- 7601 Miller Ave
- 7551 Filice Dr
- 7620 Filice Dr
- 7601 Filice Dr
- 7541 Miller Ave
- 7580 Santa Theresa Dr
Your Personal Tour Guide
Ask me questions while you tour the home.