Estimated Value: $218,097 - $268,000
3
Beds
2
Baths
1,539
Sq Ft
$159/Sq Ft
Est. Value
About This Home
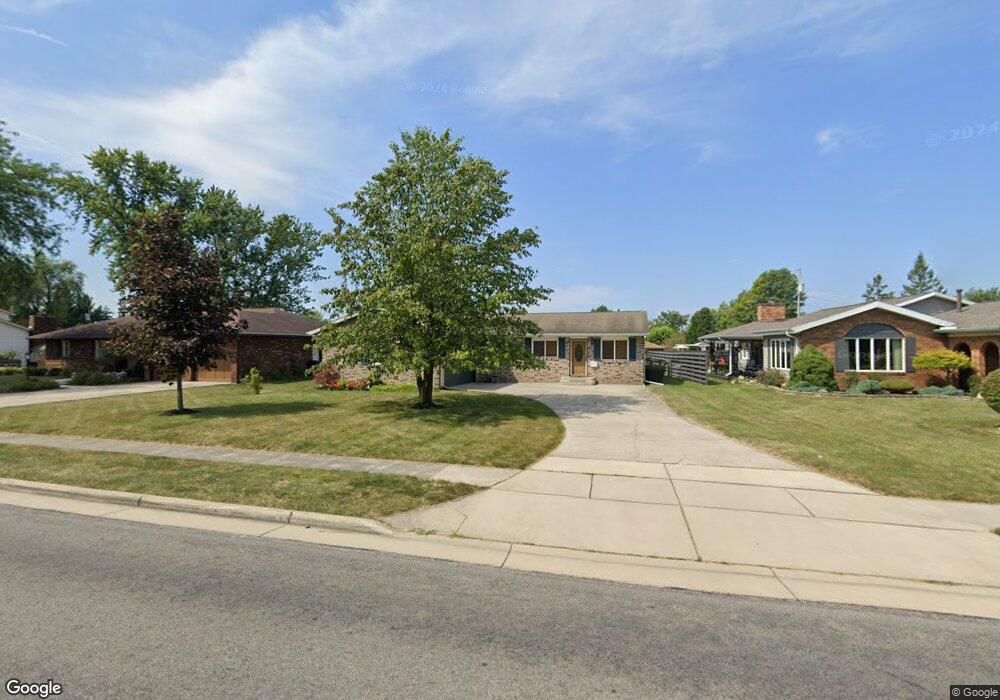
This home is located at 759 Fenway Dr, Lima, OH 45804 and is currently estimated at $244,274, approximately $158 per square foot. 759 Fenway Dr is a home located in Allen County with nearby schools including Bath Elementary School, Bath Middle School, and Bath High School.
Ownership History
Date
Name
Owned For
Owner Type
Purchase Details
Closed on
Jun 12, 2014
Sold by
Boraten Vera M
Bought by
Stone Douglas K and Stone Judy K
Current Estimated Value
Home Financials for this Owner
Home Financials are based on the most recent Mortgage that was taken out on this home.
Original Mortgage
$135,714
Outstanding Balance
$103,537
Interest Rate
4.28%
Mortgage Type
New Conventional
Estimated Equity
$140,737
Purchase Details
Closed on
Aug 25, 2011
Sold by
Boraten Henry E and Boraten Vera M
Bought by
Boraten Vera M
Purchase Details
Closed on
Dec 11, 2009
Sold by
George Pamela
Bought by
Boraten Henry E and Boraten Vera M
Purchase Details
Closed on
Jan 18, 1991
Bought by
Wooddell Constance T
Create a Home Valuation Report for This Property
The Home Valuation Report is an in-depth analysis detailing your home's value as well as a comparison with similar homes in the area
Home Values in the Area
Average Home Value in this Area
Purchase History
| Date | Buyer | Sale Price | Title Company |
|---|---|---|---|
| Stone Douglas K | $132,000 | None Available | |
| Boraten Vera M | -- | Attorney | |
| Boraten Henry E | -- | Attorney | |
| Boraten Henry E | $122,500 | Attorney | |
| Wooddell Constance T | $44,000 | -- |
Source: Public Records
Mortgage History
| Date | Status | Borrower | Loan Amount |
|---|---|---|---|
| Open | Stone Douglas K | $135,714 |
Source: Public Records
Tax History Compared to Growth
Tax History
| Year | Tax Paid | Tax Assessment Tax Assessment Total Assessment is a certain percentage of the fair market value that is determined by local assessors to be the total taxable value of land and additions on the property. | Land | Improvement |
|---|---|---|---|---|
| 2024 | $2,426 | $55,510 | $9,100 | $46,410 |
| 2023 | $2,115 | $47,040 | $7,700 | $39,340 |
| 2022 | $2,139 | $47,040 | $7,700 | $39,340 |
| 2021 | $2,147 | $47,040 | $7,700 | $39,340 |
| 2020 | $1,988 | $39,800 | $7,280 | $32,520 |
| 2019 | $1,988 | $39,800 | $7,280 | $32,520 |
| 2018 | $1,942 | $39,800 | $7,280 | $32,520 |
| 2017 | $1,738 | $35,560 | $7,280 | $28,280 |
| 2016 | $1,725 | $35,560 | $7,280 | $28,280 |
| 2015 | $1,602 | $35,560 | $7,280 | $28,280 |
| 2014 | $1,602 | $31,890 | $7,280 | $24,610 |
| 2013 | $1,608 | $31,890 | $7,280 | $24,610 |
Source: Public Records
Map
Nearby Homes
- 800 Heritage Dr
- 633 Canyon Dr
- 115 Oakview Ct
- 120 Barnsbury Dr
- 125 Kensington Cir
- 287 Barnsbury Dr
- 301 Fenway Dr
- 307 Ridge Crest Cir
- 2049 Harding Hwy
- 2223 Makin Dr
- 181 N Dana Ave
- 524 S Collins Ave
- 1224 E Market St
- 124 N Perry St
- 00 Bellefontaine Ave
- 573 Waterview Cir
- 3746 Armstead Place
- 650 S Dewey Ave
- 3833 Harding Hwy
- 304 Pinewood Cir