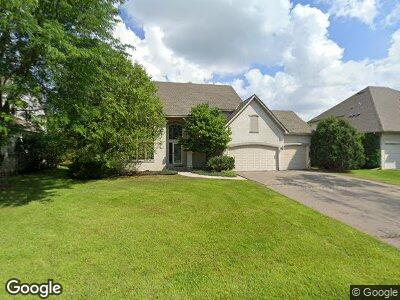
7596 Walnut Curve Chanhassen, MN 55317
Estimated Value: $670,000 - $721,000
5
Beds
4
Baths
3,367
Sq Ft
$204/Sq Ft
Est. Value
About This Home
This home is located at 7596 Walnut Curve, Chanhassen, MN 55317 and is currently estimated at $686,662, approximately $203 per square foot. 7596 Walnut Curve is a home located in Carver County with nearby schools including Bluff Creek Elementary, Chaska Middle School West, and Chanhassen High School.
Ownership History
Date
Name
Owned For
Owner Type
Purchase Details
Closed on
Jun 5, 2024
Sold by
Brooks Janene A
Bought by
Janene A Brooks Revocable Trust and Brooks
Current Estimated Value
Purchase Details
Closed on
Jul 26, 2010
Sold by
Dai Thoi and Huynh Nhuong
Bought by
Robertson Joel W and Brooks Janene A
Home Financials for this Owner
Home Financials are based on the most recent Mortgage that was taken out on this home.
Original Mortgage
$311,120
Interest Rate
4.63%
Mortgage Type
New Conventional
Purchase Details
Closed on
Jul 10, 2000
Sold by
Mitchell Michael B and Mitchell Jennifer E
Bought by
Dai Thoi and Huynh Nhuong
Purchase Details
Closed on
May 3, 1999
Sold by
Rudy Wicklander Homes Inc
Bought by
Mitchell Michael B and Mitchell Jennifer E
Purchase Details
Closed on
May 11, 1998
Sold by
Residential Development Inc
Bought by
Rudy Wicklander Homes Inc
Create a Home Valuation Report for This Property
The Home Valuation Report is an in-depth analysis detailing your home's value as well as a comparison with similar homes in the area
Home Values in the Area
Average Home Value in this Area
Purchase History
| Date | Buyer | Sale Price | Title Company |
|---|---|---|---|
| Janene A Brooks Revocable Trust | $500 | None Listed On Document | |
| Robertson Joel W | $388,900 | -- | |
| Dai Thoi | $345,000 | -- | |
| Mitchell Michael B | $289,900 | -- | |
| Rudy Wicklander Homes Inc | $59,000 | -- |
Source: Public Records
Mortgage History
| Date | Status | Borrower | Loan Amount |
|---|---|---|---|
| Previous Owner | Robertson Joel W | $311,120 |
Source: Public Records
Tax History Compared to Growth
Tax History
| Year | Tax Paid | Tax Assessment Tax Assessment Total Assessment is a certain percentage of the fair market value that is determined by local assessors to be the total taxable value of land and additions on the property. | Land | Improvement |
|---|---|---|---|---|
| 2025 | $6,416 | $632,200 | $185,000 | $447,200 |
| 2024 | $6,336 | $565,100 | $145,000 | $420,100 |
| 2023 | $9,660 | $560,800 | $145,000 | $415,800 |
| 2022 | $8,340 | $550,700 | $144,000 | $406,700 |
| 2021 | $7,178 | $480,300 | $113,100 | $367,200 |
| 2020 | $6,690 | $477,000 | $113,100 | $363,900 |
| 2019 | $6,196 | $452,800 | $107,700 | $345,100 |
| 2018 | $5,226 | $452,800 | $107,700 | $345,100 |
| 2017 | $5,320 | $416,400 | $102,600 | $313,800 |
| 2016 | $5,440 | $398,700 | $0 | $0 |
| 2015 | $5,514 | $418,900 | $0 | $0 |
| 2014 | $5,514 | $376,000 | $0 | $0 |
Source: Public Records
Map
Nearby Homes
- 7656 Prairie Flower Blvd
- 2029 Poppy Dr
- 2177 Paisley Path
- 2331 Fawn Hill Ct
- 7423 Fawn Hill Rd
- 2090 Paisley Path
- 7517 Bent Bow Trail
- 7266 Fawn Hill Rd
- 7861 Autumn Ridge Ave
- 7217 Purple Pkwy
- 7703 Vasserman Place
- 7838 Harvest Ln Unit 53
- 7882 Autumn Ridge Ave
- 2408 Hunter Dr
- 7154 Alphabet St
- 7216 Gunflint Trail
- 7625 Century Ct
- 2839 Arboretum Village Trail
- 1824 Lucy Ridge Cir
- 2839 Coach Ct
- 7596 Walnut Curve
- 7600 Walnut Curve
- 7592 Walnut Curve
- 7602 Walnut Curve
- 7588 Walnut Curve
- 7599 Walnut Curve
- 7601 Walnut Curve
- 2145 Brinker St
- 7604 Walnut Curve
- 2131 Brinker St
- 7584 Walnut Curve
- 7591 Walnut Curve
- 2159 Brinker St
- 2117 Brinker St
- 7587 Walnut Curve
- 7611 Prairie Flower Blvd
- 7580 Walnut Curve
- 7606 Walnut Curve
- 7583 Walnut Curve
- 2173 Brinker St